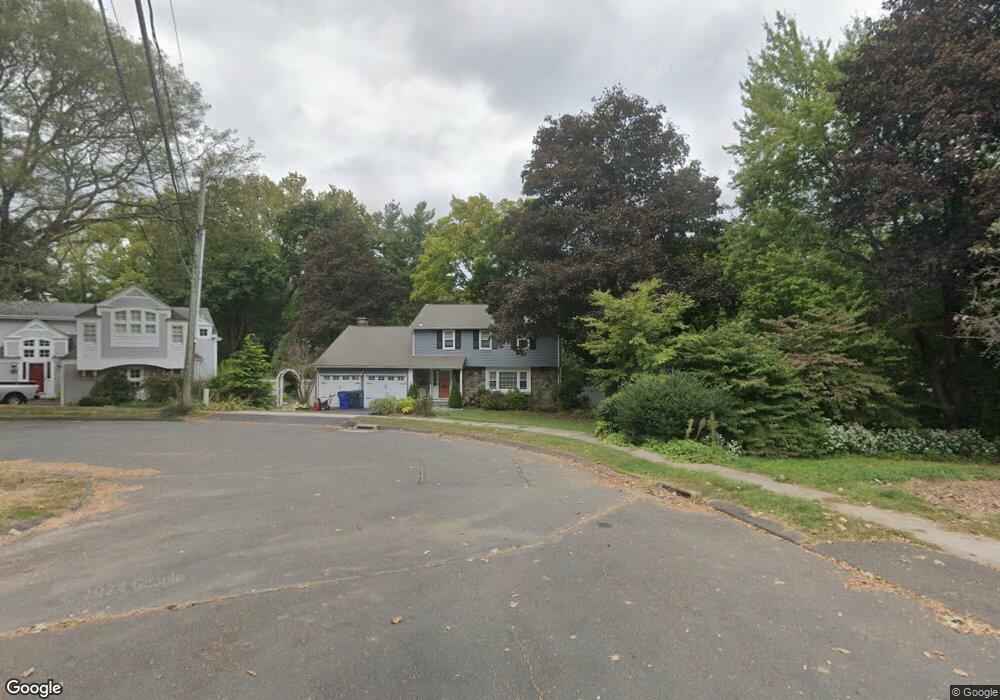
17 Pebblebrook Dr West Hartford, CT 06107
Estimated Value: $633,740 - $773,000
4
Beds
3
Baths
1,955
Sq Ft
$342/Sq Ft
Est. Value
About This Home
This home is located at 17 Pebblebrook Dr, West Hartford, CT 06107 and is currently estimated at $669,435, approximately $342 per square foot. 17 Pebblebrook Dr is a home located in Hartford County with nearby schools including Webster Hill School, Sedgwick Middle School, and Conard High School.
Ownership History
Date
Name
Owned For
Owner Type
Purchase Details
Closed on
Oct 29, 2021
Sold by
Barnard Kevin P
Bought by
K P Barnard 2021 Ret
Current Estimated Value
Purchase Details
Closed on
Sep 16, 2013
Sold by
Pazdersky Gregory J and Kaufman Janet S
Bought by
Barnard Kevin P
Home Financials for this Owner
Home Financials are based on the most recent Mortgage that was taken out on this home.
Original Mortgage
$351,975
Interest Rate
4.43%
Purchase Details
Closed on
Oct 30, 1990
Sold by
Dickert Robert
Bought by
Pazdersky Gregory
Home Financials for this Owner
Home Financials are based on the most recent Mortgage that was taken out on this home.
Original Mortgage
$163,200
Interest Rate
10.08%
Purchase Details
Closed on
May 26, 1987
Sold by
2100 Stanley St Rt
Bought by
Kilpatrick Lawrence J
Create a Home Valuation Report for This Property
The Home Valuation Report is an in-depth analysis detailing your home's value as well as a comparison with similar homes in the area
Home Values in the Area
Average Home Value in this Area
Purchase History
| Date | Buyer | Sale Price | Title Company |
|---|---|---|---|
| K P Barnard 2021 Ret | -- | None Available | |
| Barnard Kevin P | $370,500 | -- | |
| Pazdersky Gregory | $204,000 | -- | |
| Kilpatrick Lawrence J | $69,500 | -- |
Source: Public Records
Mortgage History
| Date | Status | Borrower | Loan Amount |
|---|---|---|---|
| Previous Owner | Barnard Kevin P | $351,975 | |
| Previous Owner | Kilpatrick Lawrence J | $245,000 | |
| Previous Owner | Kilpatrick Lawrence J | $100,000 | |
| Previous Owner | Kilpatrick Lawrence J | $163,200 | |
| Previous Owner | Kilpatrick Lawrence J | $40,000 |
Source: Public Records
Tax History Compared to Growth
Tax History
| Year | Tax Paid | Tax Assessment Tax Assessment Total Assessment is a certain percentage of the fair market value that is determined by local assessors to be the total taxable value of land and additions on the property. | Land | Improvement |
|---|---|---|---|---|
| 2025 | $13,093 | $292,390 | $112,070 | $180,320 |
| 2024 | $12,383 | $292,390 | $112,070 | $180,320 |
| 2023 | $11,965 | $292,390 | $112,070 | $180,320 |
| 2022 | $11,894 | $292,390 | $112,070 | $180,320 |
| 2021 | $11,685 | $275,450 | $115,430 | $160,020 |
| 2020 | $10,996 | $263,060 | $108,150 | $154,910 |
| 2019 | $10,504 | $251,300 | $108,150 | $143,150 |
| 2018 | $10,303 | $251,300 | $108,150 | $143,150 |
| 2017 | $10,313 | $251,300 | $108,150 | $143,150 |
| 2016 | $9,854 | $249,410 | $90,720 | $158,690 |
| 2015 | $9,555 | $249,410 | $90,720 | $158,690 |
| 2014 | $9,320 | $249,410 | $90,720 | $158,690 |
Source: Public Records
Map
Nearby Homes
- 26 Pheasant Hill Dr
- 63 Rumford St
- 126 Westminster Dr
- 88 Spring Ln
- 632 Park Rd
- 6 Greenhurst Rd
- 51 Lemay St
- 50 Tunxis Rd
- 1925 Boulevard
- 1640 Boulevard
- 42 Fairwood Farms Dr
- 29 Fairwood Farms Dr
- 117 Tunxis Rd
- 14 Hedwig Ct
- 69 Fairwood Farms Dr
- 2 Arapahoe Rd Unit 308
- 2 Arapahoe Rd Unit 415
- 2 Arapahoe Rd Unit 611
- 2 Arapahoe Rd Unit 613
- 2 Arapahoe Rd Unit 311
- 58 Ridgebrook Dr
- 60 Ridgebrook Dr
- 16 Pebblebrook Dr
- 15 Pebblebrook Dr
- 11 Pebblebrook Dr
- 54 Ridgebrook Dr
- 62 Ridgebrook Dr
- 50 Ridgebrook Dr
- 12 Pebblebrook Dr
- 46 Ridgebrook Dr
- 199 S Main St
- 64 Ridgebrook Dr
- 203 S Main St
- 44 Ridgebrook Dr
- 10 Pebblebrook Dr
- 42 Ridgebrook Dr
- 33 Scarsdale Rd
- 61 Ridgebrook Dr
- 6 Pebblebrook Dr
- 65 Ridgebrook Dr