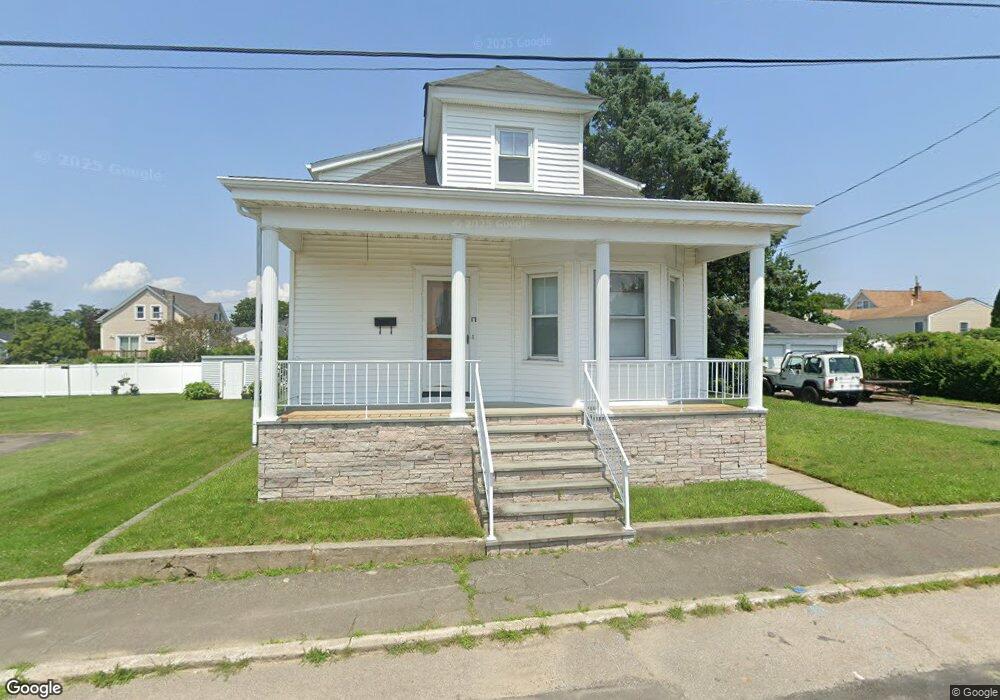
17 Perry St Unit 1 South Dartmouth, MA 02748
Bliss Corner NeighborhoodEstimated Value: $409,000 - $462,000
2
Beds
1
Bath
1,534
Sq Ft
$284/Sq Ft
Est. Value
About This Home
This home is located at 17 Perry St Unit 1, South Dartmouth, MA 02748 and is currently estimated at $435,567, approximately $283 per square foot. 17 Perry St Unit 1 is a home located in Bristol County with nearby schools including Dartmouth High School and St. Teresa of Calcutta School.
Ownership History
Date
Name
Owned For
Owner Type
Purchase Details
Closed on
Nov 30, 2016
Sold by
Medeiros Realty Llc
Bought by
Silva Fernando A
Current Estimated Value
Home Financials for this Owner
Home Financials are based on the most recent Mortgage that was taken out on this home.
Original Mortgage
$165,000
Outstanding Balance
$133,234
Interest Rate
3.52%
Mortgage Type
New Conventional
Estimated Equity
$302,333
Purchase Details
Closed on
Dec 2, 2011
Sold by
Ducharme Douglas B and Ducharme Elizabeth D
Bought by
Ducharme Douglas B
Purchase Details
Closed on
Aug 13, 2001
Sold by
Brosius Janice D
Bought by
Medeiros Judith M
Create a Home Valuation Report for This Property
The Home Valuation Report is an in-depth analysis detailing your home's value as well as a comparison with similar homes in the area
Home Values in the Area
Average Home Value in this Area
Purchase History
| Date | Buyer | Sale Price | Title Company |
|---|---|---|---|
| Silva Fernando A | $245,000 | -- | |
| Ducharme Douglas B | -- | -- | |
| Medeiros Judith M | $68,375 | -- |
Source: Public Records
Mortgage History
| Date | Status | Borrower | Loan Amount |
|---|---|---|---|
| Open | Silva Fernando A | $165,000 |
Source: Public Records
Tax History Compared to Growth
Tax History
| Year | Tax Paid | Tax Assessment Tax Assessment Total Assessment is a certain percentage of the fair market value that is determined by local assessors to be the total taxable value of land and additions on the property. | Land | Improvement |
|---|---|---|---|---|
| 2025 | $2,720 | $315,900 | $121,600 | $194,300 |
| 2024 | $2,577 | $296,500 | $121,600 | $174,900 |
| 2023 | $2,661 | $290,200 | $121,600 | $168,600 |
| 2022 | $2,612 | $263,800 | $121,600 | $142,200 |
| 2021 | $2,320 | $223,900 | $118,100 | $105,800 |
| 2020 | $2,330 | $224,500 | $116,900 | $107,600 |
| 2019 | $2,132 | $205,000 | $112,200 | $92,800 |
| 2018 | $2,190 | $218,300 | $114,500 | $103,800 |
| 2017 | $2,117 | $211,300 | $105,800 | $105,500 |
| 2016 | $1,984 | $195,300 | $93,600 | $101,700 |
| 2015 | $1,899 | $187,300 | $87,400 | $99,900 |
| 2014 | $1,845 | $180,700 | $84,900 | $95,800 |
Source: Public Records
Map
Nearby Homes