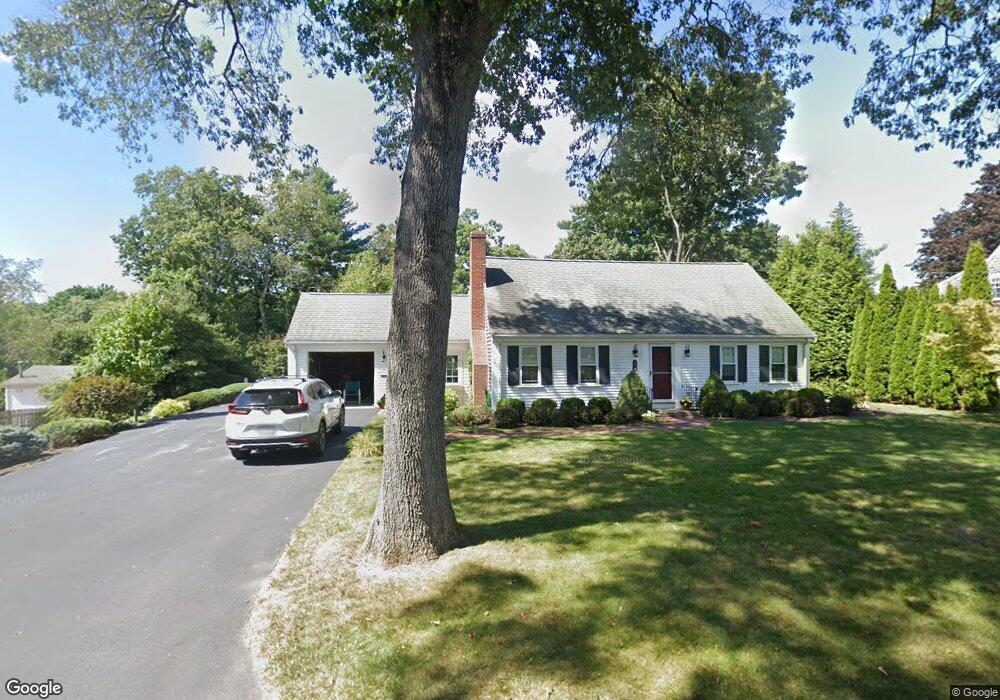
17 Peter Hobart Dr Hingham, MA 02043
South Hingham NeighborhoodEstimated Value: $961,000 - $1,126,000
About This Home
This home is located at 17 Peter Hobart Dr, Hingham, MA 02043 and is currently estimated at $1,047,521, approximately $504 per square foot. 17 Peter Hobart Dr is a home located in Plymouth County with nearby schools including South Elementary School, Hingham Middle School, and Hingham High School.
Ownership History
We collect this data history from publicly available records. To have your information removed, we recommend requesting removal directly through your county’s website.
Purchase Details
Purchase Details
Home Values in the Area
Average Home Value in this Area
Purchase History
We collect this data history from publicly available records. To have your information removed, we recommend requesting removal directly through your county’s website.
| Date | Buyer | Sale Price | Title Company |
|---|---|---|---|
| -- | -- | ||
| -- | -- |
Mortgage History
We collect this data history from publicly available records. To have your information removed, we recommend requesting removal directly through your county’s website.
| Date | Status | Borrower | Loan Amount |
|---|---|---|---|
| Previous Owner | $135,000 |
Tax History
We collect this data history from publicly available records. To have your information removed, we recommend requesting removal directly through your county’s website.
| Year | Tax Paid | Tax Assessment Tax Assessment Total Assessment is a certain percentage of the fair market value that is determined by local assessors to be the total taxable value of land and additions on the property. | Land | Improvement |
|---|---|---|---|---|
| 2025 | $10,415 | $974,300 | $456,600 | $517,700 |
| 2024 | $9,954 | $917,400 | $456,600 | $460,800 |
| 2023 | $8,556 | $855,600 | $456,600 | $399,000 |
| 2022 | $7,874 | $681,100 | $352,400 | $328,700 |
| 2021 | $7,511 | $636,500 | $352,400 | $284,100 |
| 2020 | $7,339 | $636,500 | $352,400 | $284,100 |
| 2019 | $7,225 | $611,800 | $352,400 | $259,400 |
| 2018 | $6,689 | $568,300 | $352,400 | $215,900 |
| 2017 | $7,045 | $575,100 | $360,500 | $214,600 |
| 2016 | $6,968 | $557,900 | $343,300 | $214,600 |
| 2015 | $6,788 | $541,700 | $327,100 | $214,600 |
Map
- 215 Gardner St
- 295 Gardner St
- 494 Cushing St
- 14 Whiting Ln
- 25 Whiting Ln Unit 25
- 443 Cushing St
- 491 Cushing St
- 371 Gardner St
- 76 Gardner St
- 1154 Main St
- 4 Edward Cody Ln
- 6 Presidents Rd
- 14 Puritan Rd
- 20 Colonial Rd
- 563 Pine St
- 36 Independence Ln
- 12 Stagecoach Rd
- 113 Oak St
- 198 Pond St
- 71 Clubhouse Dr
- 248 Gardner St
- 260 Gardner St
- 244 Gardner St
- 15 Peter Hobart Dr
- 256 Gardner St
- 238 Gardner St
- 237 Gardner St
- 237 Gardner St Unit 237
- 237 Gardner St
- 9 Peter Hobart Dr
- 233 Gardner St
- 19 Peter Hobart Dr
- 19 Peter Hobart Dr
- 262 Gardner St
- 227 Gardner St
- 270 Gardner St
- 14 Derby St
- 14 Peter Hobart Dr
- 8 Derby St
- 16 Peter Hobart Dr
Ask me questions while you tour the home.