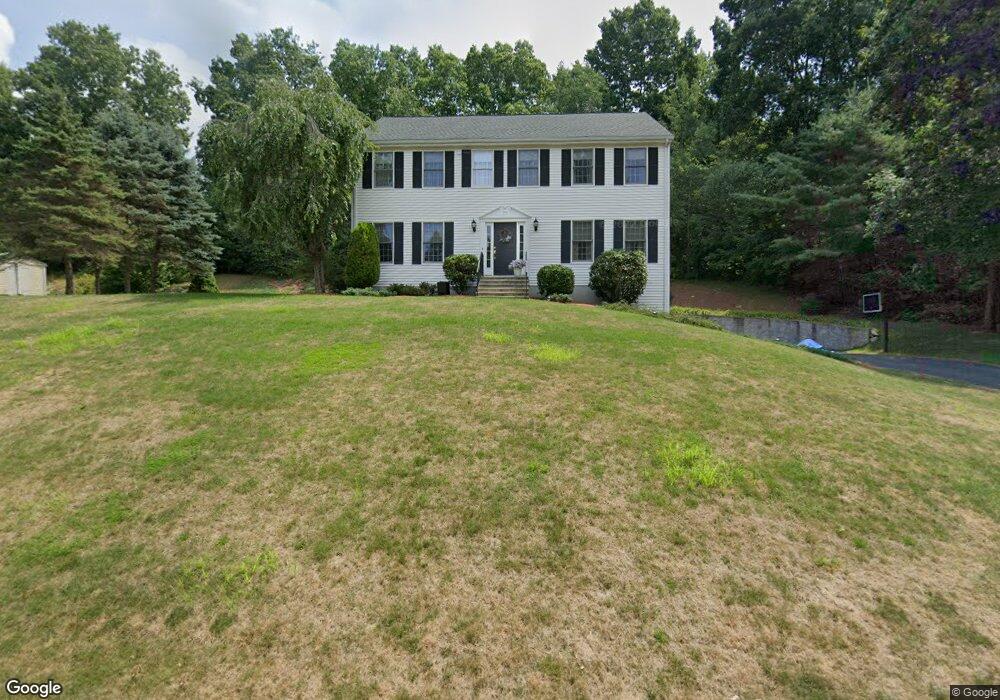
17 Phylmor Dr Westborough, MA 01581
Estimated Value: $869,000 - $1,160,000
4
Beds
3
Baths
2,352
Sq Ft
$411/Sq Ft
Est. Value
About This Home
This home is located at 17 Phylmor Dr, Westborough, MA 01581 and is currently estimated at $966,095, approximately $410 per square foot. 17 Phylmor Dr is a home located in Worcester County with nearby schools including Westborough High School and Ebridge Montessori School.
Ownership History
Date
Name
Owned For
Owner Type
Purchase Details
Closed on
Jun 11, 2024
Sold by
Glaser Andrew C and Glaser Anna C
Bought by
Glaser Ft and Glaser
Current Estimated Value
Purchase Details
Closed on
May 2, 1994
Sold by
Grafton Building Co
Bought by
Glaser Andrew C and Glaser Anna C
Purchase Details
Closed on
Jan 11, 1994
Sold by
Moroney Phyllis
Bought by
Grafton Building Co
Create a Home Valuation Report for This Property
The Home Valuation Report is an in-depth analysis detailing your home's value as well as a comparison with similar homes in the area
Home Values in the Area
Average Home Value in this Area
Purchase History
| Date | Buyer | Sale Price | Title Company |
|---|---|---|---|
| Glaser Ft | -- | None Available | |
| Glaser Ft | -- | None Available | |
| Glaser Andrew C | $274,566 | -- | |
| Grafton Building Co | $65,000 | -- | |
| Glaser Andrew C | $274,566 | -- | |
| Grafton Building Co | $65,000 | -- |
Source: Public Records
Mortgage History
| Date | Status | Borrower | Loan Amount |
|---|---|---|---|
| Previous Owner | Grafton Building Co | $230,000 | |
| Previous Owner | Grafton Building Co | $207,000 | |
| Previous Owner | Grafton Building Co | $215,000 |
Source: Public Records
Tax History
| Year | Tax Paid | Tax Assessment Tax Assessment Total Assessment is a certain percentage of the fair market value that is determined by local assessors to be the total taxable value of land and additions on the property. | Land | Improvement |
|---|---|---|---|---|
| 2025 | $13,182 | $809,200 | $344,600 | $464,600 |
| 2024 | $12,585 | $766,900 | $328,100 | $438,800 |
| 2023 | $12,012 | $713,300 | $309,400 | $403,900 |
| 2022 | $11,238 | $607,800 | $253,400 | $354,400 |
| 2021 | $10,807 | $582,900 | $228,500 | $354,400 |
| 2020 | $10,441 | $569,900 | $224,300 | $345,600 |
| 2019 | $10,210 | $557,000 | $222,200 | $334,800 |
| 2018 | $6,643 | $512,600 | $213,900 | $298,700 |
| 2017 | $6,538 | $512,600 | $213,900 | $298,700 |
| 2016 | $9,050 | $509,300 | $207,700 | $301,600 |
| 2015 | $8,832 | $475,100 | $195,200 | $279,900 |
Source: Public Records
Map
Nearby Homes
- 46 Lackey St
- 48 Lackey St
- 57 Spring Rd
- 186 Spring St
- 4 Donna Pass
- 60 Belknap St
- 14 Gilmore Farm Rd
- 11 Quick Farm Rd
- 14 Baldwin Ct Unit 14
- 2 Spring Ln
- 352 Wood St
- 26 Mount Pleasant St
- 10 Andrea Dr
- LL39 Libbey Ln
- 248 W Main St
- 34 Harvey Ln
- 192 W Main St
- 37 Oneil Dr
- 22 Capt Samuel Forbush Rd
- 12 Boot Shop Rd Unit 37
Your Personal Tour Guide
Ask me questions while you tour the home.