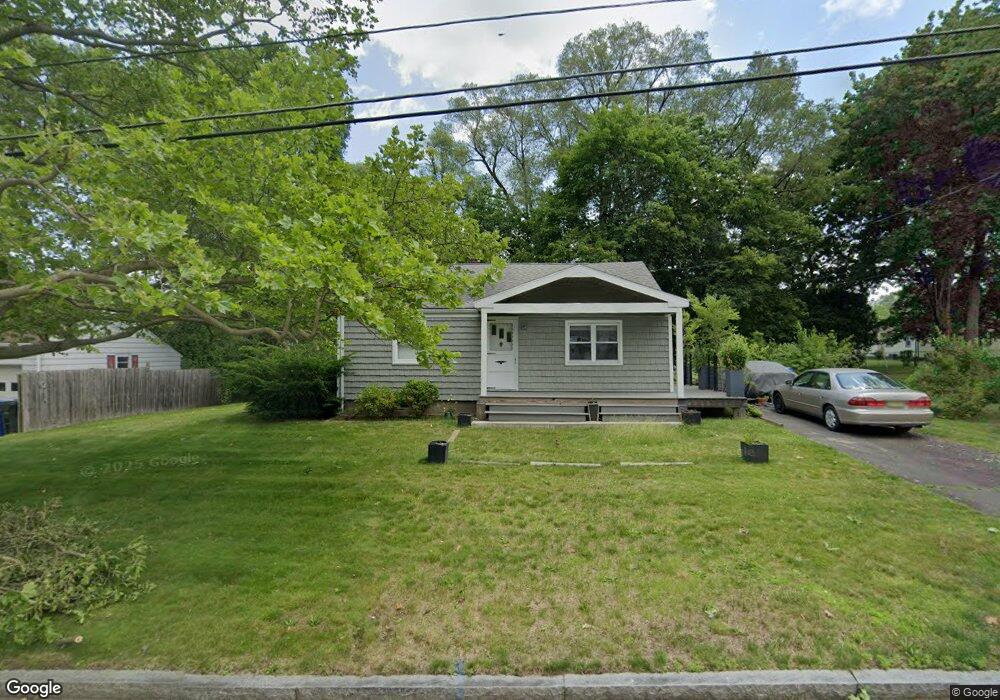
17 Pineview Dr Springfield, MA 01119
Sixteen Acres NeighborhoodEstimated Value: $265,000 - $287,000
2
Beds
1
Bath
768
Sq Ft
$362/Sq Ft
Est. Value
About This Home
This home is located at 17 Pineview Dr, Springfield, MA 01119 and is currently estimated at $278,378, approximately $362 per square foot. 17 Pineview Dr is a home located in Hampden County with nearby schools including Glickman Elementary, John J Duggan Middle, and Springfield High School of Science and Technology.
Ownership History
Date
Name
Owned For
Owner Type
Purchase Details
Closed on
Feb 15, 2005
Sold by
Baczewski Lisa and Griffin Lisa
Bought by
Kiige Liliana and Kiige Maina
Current Estimated Value
Home Financials for this Owner
Home Financials are based on the most recent Mortgage that was taken out on this home.
Original Mortgage
$116,400
Outstanding Balance
$59,475
Interest Rate
5.83%
Mortgage Type
Purchase Money Mortgage
Estimated Equity
$218,903
Create a Home Valuation Report for This Property
The Home Valuation Report is an in-depth analysis detailing your home's value as well as a comparison with similar homes in the area
Home Values in the Area
Average Home Value in this Area
Purchase History
| Date | Buyer | Sale Price | Title Company |
|---|---|---|---|
| Kiige Liliana | $120,000 | -- |
Source: Public Records
Mortgage History
| Date | Status | Borrower | Loan Amount |
|---|---|---|---|
| Open | Kiige Liliana | $116,400 | |
| Closed | Kiige Liliana | $3,600 |
Source: Public Records
Tax History
| Year | Tax Paid | Tax Assessment Tax Assessment Total Assessment is a certain percentage of the fair market value that is determined by local assessors to be the total taxable value of land and additions on the property. | Land | Improvement |
|---|---|---|---|---|
| 2025 | $3,537 | $225,600 | $52,000 | $173,600 |
| 2024 | $3,324 | $207,000 | $52,000 | $155,000 |
| 2023 | $2,951 | $173,100 | $49,500 | $123,600 |
| 2022 | $3,007 | $159,800 | $49,500 | $110,300 |
| 2021 | $2,640 | $139,700 | $45,000 | $94,700 |
| 2020 | $2,556 | $130,900 | $45,000 | $85,900 |
| 2019 | $2,413 | $122,600 | $45,000 | $77,600 |
| 2018 | $2,450 | $124,500 | $45,000 | $79,500 |
| 2017 | $2,454 | $124,800 | $44,900 | $79,900 |
| 2016 | $2,395 | $121,800 | $44,900 | $76,900 |
| 2015 | $2,303 | $117,100 | $44,900 | $72,200 |
Source: Public Records
Map
Nearby Homes
- 63 Granger St
- 108 Birchland Ave
- 106-108 Breckwood Cir
- 74 Valley Rd
- 73 Timber Ln
- 854 Grayson Dr
- 64 Wilmington St
- 381 N Brook Rd
- 251 Rosewell St
- 130 Spear Rd
- 63 Lawton St
- 8 Putnam St
- 46 Puritan Cir
- 187 Lamont St
- Lot 37 Kane St
- 114 Riverton Rd
- 186 Bolton St
- 944 Wilbraham Rd
- 150 Seymour Ave
- 195 Almira Rd
- 25 Pineview Dr
- 1376 Wilbraham Rd
- 20 Denwall Dr
- 30 Denwall Dr
- 1388 Wilbraham Rd
- 18 Pineview Dr
- 35 Pineview Dr
- 1360 Wilbraham Rd
- 26 Pineview Dr
- 38 Denwall Dr
- 36 Pineview Dr
- 19 Denwall Dr
- 45 Pineview Dr
- 15 Lemnos Ln
- 11 Denwall Dr
- 29 Denwall Dr
- 1350 Wilbraham Rd
- 48 Denwall Dr
- 29 Lemnos Ln
- 1404 Wilbraham Rd
Your Personal Tour Guide
Ask me questions while you tour the home.