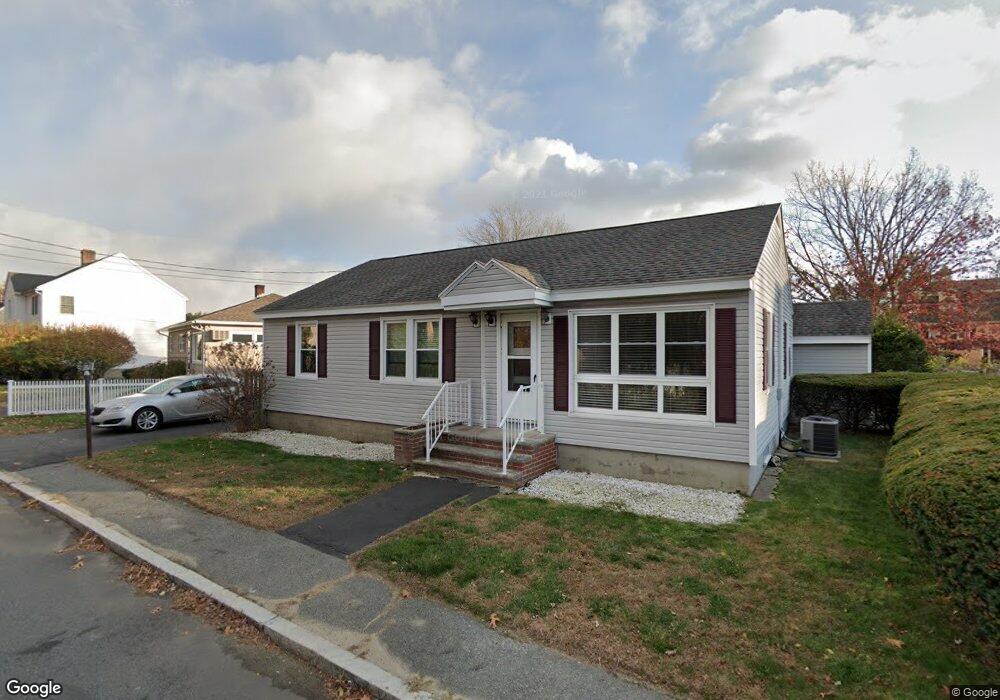
17 Pitman St Methuen, MA 01844
The East End NeighborhoodEstimated Value: $495,000 - $633,000
3
Beds
3
Baths
2,034
Sq Ft
$277/Sq Ft
Est. Value
About This Home
This home is located at 17 Pitman St, Methuen, MA 01844 and is currently estimated at $562,417, approximately $276 per square foot. 17 Pitman St is a home located in Essex County with nearby schools including South Point Elementary School, Methuen High School, and Community Day Charter Public School - Gateway.
Ownership History
Date
Name
Owned For
Owner Type
Purchase Details
Closed on
May 5, 2021
Sold by
Coleman Thomas L and Coleman Dorothy L
Bought by
Shea Brian D
Current Estimated Value
Purchase Details
Closed on
Feb 14, 2005
Sold by
Anthony and Anthony Dorothy Calder
Bought by
Coleman Thomas L and Coleman Dorothy L
Home Financials for this Owner
Home Financials are based on the most recent Mortgage that was taken out on this home.
Original Mortgage
$232,000
Interest Rate
5.83%
Mortgage Type
Purchase Money Mortgage
Create a Home Valuation Report for This Property
The Home Valuation Report is an in-depth analysis detailing your home's value as well as a comparison with similar homes in the area
Home Values in the Area
Average Home Value in this Area
Purchase History
| Date | Buyer | Sale Price | Title Company |
|---|---|---|---|
| Shea Brian D | -- | None Available | |
| Shea Brian D | -- | None Available | |
| Coleman Thomas L | $290,000 | -- | |
| Coleman Thomas L | $290,000 | -- |
Source: Public Records
Mortgage History
| Date | Status | Borrower | Loan Amount |
|---|---|---|---|
| Previous Owner | Coleman Thomas L | $232,000 |
Source: Public Records
Tax History Compared to Growth
Tax History
| Year | Tax Paid | Tax Assessment Tax Assessment Total Assessment is a certain percentage of the fair market value that is determined by local assessors to be the total taxable value of land and additions on the property. | Land | Improvement |
|---|---|---|---|---|
| 2025 | $4,710 | $445,200 | $196,700 | $248,500 |
| 2024 | $4,648 | $428,000 | $179,500 | $248,500 |
| 2023 | $4,392 | $375,400 | $159,500 | $215,900 |
| 2022 | $4,219 | $323,300 | $132,900 | $190,400 |
| 2021 | $3,958 | $300,100 | $126,300 | $173,800 |
| 2020 | $3,949 | $293,800 | $126,300 | $167,500 |
| 2019 | $3,654 | $257,500 | $113,000 | $144,500 |
| 2018 | $3,495 | $249,900 | $113,000 | $136,900 |
| 2017 | $3,456 | $235,900 | $113,000 | $122,900 |
| 2016 | $3,300 | $222,800 | $106,300 | $116,500 |
| 2015 | $3,197 | $219,000 | $106,300 | $112,700 |
Source: Public Records
Map
Nearby Homes
- 29 Wallace St
- 29 Pitman St
- 2 Goodrich Ave
- 45 Christopher Dr Unit 101
- 23 Constitution Way Unit 23
- 23 Constitution Way
- 95 Pilgrim Cir Unit 95
- 17 Ferry Rd
- 27 Russell Farm Dr
- 86 Comet Rd
- 49 Golf Ave
- 128 Pleasant Valley St
- 122 Pleasant Valley St
- 6 Aberdeen Rd
- 107 Farrwood Dr Unit 107
- 115 Merrimack Rd
- 3 Thissell St
- 46 Oneida St
- 50 Woburn St
- 369 Farrwood Dr