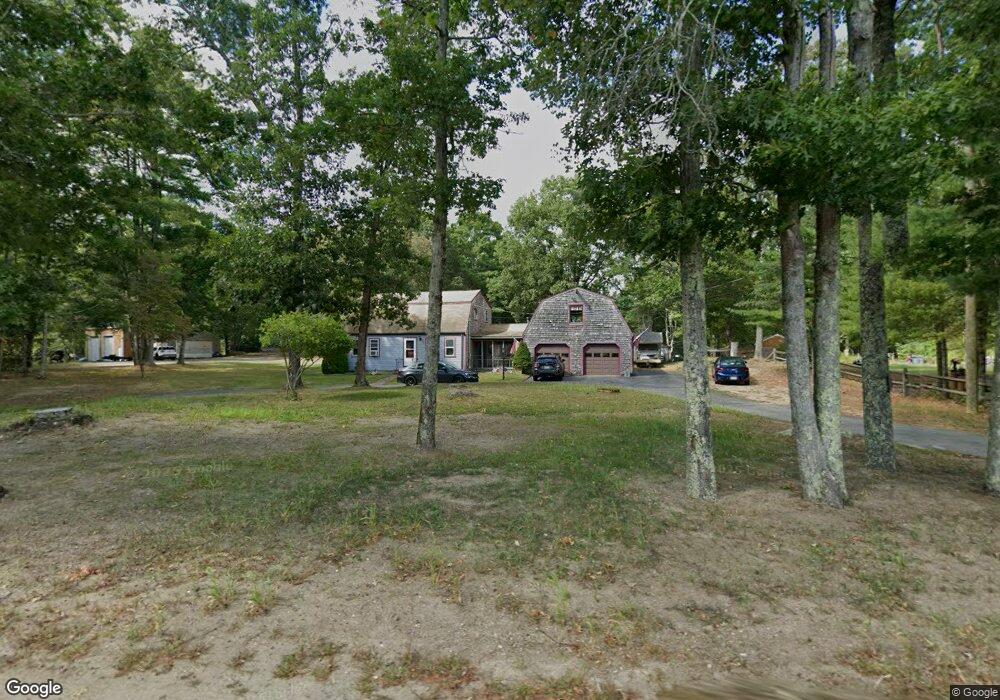
17 Plymouth St Carver, MA 02330
Estimated Value: $604,061 - $721,000
3
Beds
2
Baths
1,666
Sq Ft
$396/Sq Ft
Est. Value
About This Home
This home is located at 17 Plymouth St, Carver, MA 02330 and is currently estimated at $659,515, approximately $395 per square foot. 17 Plymouth St is a home located in Plymouth County with nearby schools including Carver Elementary School, Carver Middle/High School, and Rising Tide Charter Public School.
Ownership History
Date
Name
Owned For
Owner Type
Purchase Details
Closed on
Sep 9, 2008
Sold by
17 Plymouth Street Nt
Bought by
Furtado David N and Furtado Heather E
Current Estimated Value
Home Financials for this Owner
Home Financials are based on the most recent Mortgage that was taken out on this home.
Original Mortgage
$276,750
Interest Rate
6.69%
Mortgage Type
Purchase Money Mortgage
Purchase Details
Closed on
Nov 6, 2002
Sold by
Geer Francis H and Geer Sarah D
Bought by
Pontz Joel J and Whalen Lisa A
Create a Home Valuation Report for This Property
The Home Valuation Report is an in-depth analysis detailing your home's value as well as a comparison with similar homes in the area
Home Values in the Area
Average Home Value in this Area
Purchase History
| Date | Buyer | Sale Price | Title Company |
|---|---|---|---|
| Furtado David N | $307,500 | -- | |
| Pontz Joel J | $250,000 | -- |
Source: Public Records
Mortgage History
| Date | Status | Borrower | Loan Amount |
|---|---|---|---|
| Open | Pontz Joel J | $275,000 | |
| Closed | Pontz Joel J | $276,750 |
Source: Public Records
Tax History Compared to Growth
Tax History
| Year | Tax Paid | Tax Assessment Tax Assessment Total Assessment is a certain percentage of the fair market value that is determined by local assessors to be the total taxable value of land and additions on the property. | Land | Improvement |
|---|---|---|---|---|
| 2025 | $6,816 | $491,400 | $142,600 | $348,800 |
| 2024 | $6,425 | $453,400 | $139,800 | $313,600 |
| 2023 | $6,246 | $428,100 | $139,800 | $288,300 |
| 2022 | $5,892 | $368,700 | $119,600 | $249,100 |
| 2021 | $5,614 | $331,400 | $106,800 | $224,600 |
| 2020 | $5,396 | $313,900 | $99,800 | $214,100 |
| 2019 | $5,205 | $305,300 | $96,900 | $208,400 |
| 2018 | $5,017 | $284,600 | $96,900 | $187,700 |
| 2017 | $4,842 | $273,700 | $93,200 | $180,500 |
| 2016 | $4,455 | $261,600 | $88,800 | $172,800 |
| 2015 | $4,327 | $254,400 | $88,800 | $165,600 |
| 2014 | $4,278 | $251,500 | $112,200 | $139,300 |
Source: Public Records
Map
Nearby Homes