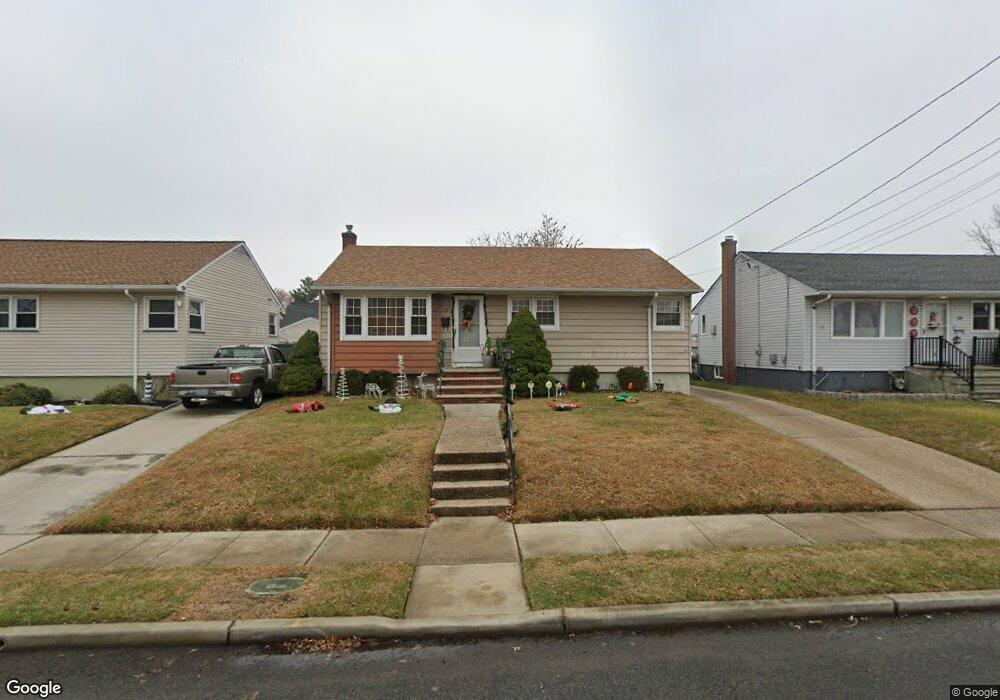
17 Polk Ave Carteret, NJ 07008
Estimated Value: $394,000 - $542,000
3
Beds
1
Bath
1,050
Sq Ft
$445/Sq Ft
Est. Value
About This Home
This home is located at 17 Polk Ave, Carteret, NJ 07008 and is currently estimated at $467,183, approximately $444 per square foot. 17 Polk Ave is a home located in Middlesex County with nearby schools including Carteret High School and St Joseph School.
Ownership History
Date
Name
Owned For
Owner Type
Purchase Details
Closed on
Jun 24, 2016
Sold by
Mann Daljit
Bought by
Mann Sharanjit K
Current Estimated Value
Purchase Details
Closed on
Apr 14, 2014
Sold by
Singh Baljeet and Kaur Balwinder
Bought by
Mann Daljit
Purchase Details
Closed on
Jul 14, 2005
Sold by
Wasylyk Donald
Bought by
Kaur Bahinder
Home Financials for this Owner
Home Financials are based on the most recent Mortgage that was taken out on this home.
Original Mortgage
$232,000
Interest Rate
5.25%
Mortgage Type
Adjustable Rate Mortgage/ARM
Create a Home Valuation Report for This Property
The Home Valuation Report is an in-depth analysis detailing your home's value as well as a comparison with similar homes in the area
Home Values in the Area
Average Home Value in this Area
Purchase History
| Date | Buyer | Sale Price | Title Company |
|---|---|---|---|
| Mann Sharanjit K | -- | None Available | |
| Mann Daljit | $165,000 | None Available | |
| Kaur Bahinder | $290,000 | -- |
Source: Public Records
Mortgage History
| Date | Status | Borrower | Loan Amount |
|---|---|---|---|
| Previous Owner | Kaur Bahinder | $232,000 |
Source: Public Records
Tax History Compared to Growth
Tax History
| Year | Tax Paid | Tax Assessment Tax Assessment Total Assessment is a certain percentage of the fair market value that is determined by local assessors to be the total taxable value of land and additions on the property. | Land | Improvement |
|---|---|---|---|---|
| 2025 | $6,551 | $447,500 | $330,000 | $117,500 |
| 2024 | $6,383 | $205,500 | $120,000 | $85,500 |
| 2023 | $6,383 | $205,500 | $120,000 | $85,500 |
| 2022 | $6,206 | $205,500 | $120,000 | $85,500 |
| 2021 | $4,521 | $205,500 | $120,000 | $85,500 |
| 2020 | $5,910 | $205,500 | $120,000 | $85,500 |
| 2019 | $5,740 | $205,500 | $120,000 | $85,500 |
| 2018 | $5,604 | $205,500 | $120,000 | $85,500 |
| 2017 | $5,405 | $205,500 | $120,000 | $85,500 |
| 2016 | $5,523 | $174,400 | $90,000 | $84,400 |
| 2015 | $5,443 | $174,400 | $90,000 | $84,400 |
| 2014 | $5,206 | $174,400 | $90,000 | $84,400 |
Source: Public Records
Map
Nearby Homes