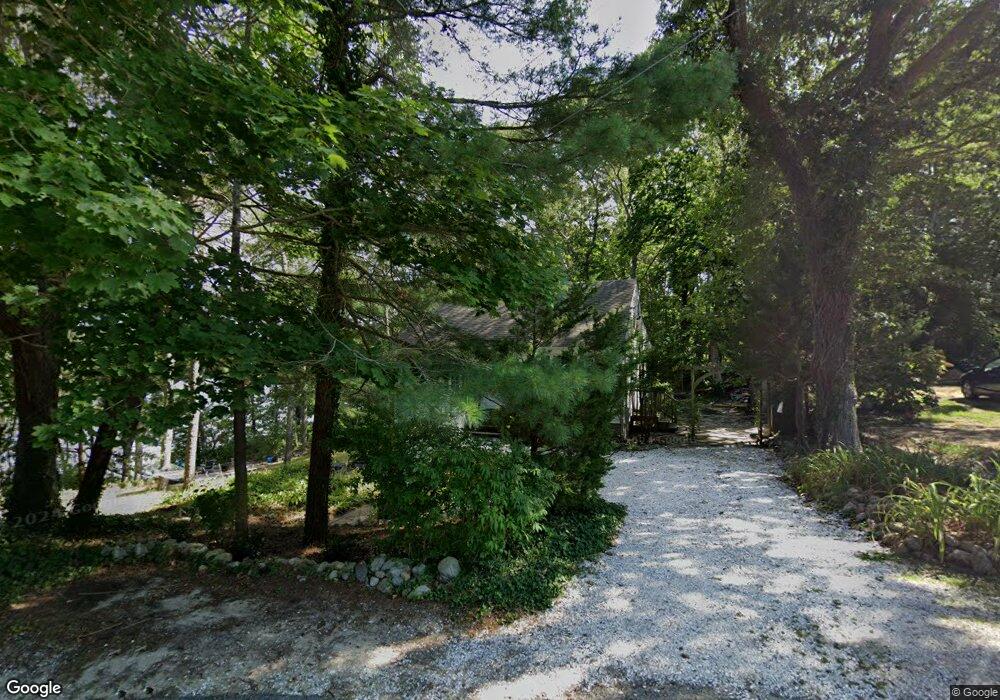
17 Pond St Dennis, MA 02638
Dennis Village NeighborhoodEstimated Value: $586,273 - $845,000
3
Beds
1
Bath
1,204
Sq Ft
$548/Sq Ft
Est. Value
About This Home
This home is located at 17 Pond St, Dennis, MA 02638 and is currently estimated at $660,318, approximately $548 per square foot. 17 Pond St is a home located in Barnstable County with nearby schools including Dennis-Yarmouth Regional High School and St. Pius X. School.
Ownership History
Date
Name
Owned For
Owner Type
Purchase Details
Closed on
Jan 16, 1990
Sold by
Payne M Carol
Bought by
Boydstun Loren D
Current Estimated Value
Home Financials for this Owner
Home Financials are based on the most recent Mortgage that was taken out on this home.
Original Mortgage
$120,000
Interest Rate
9.61%
Mortgage Type
Purchase Money Mortgage
Create a Home Valuation Report for This Property
The Home Valuation Report is an in-depth analysis detailing your home's value as well as a comparison with similar homes in the area
Home Values in the Area
Average Home Value in this Area
Purchase History
| Date | Buyer | Sale Price | Title Company |
|---|---|---|---|
| Boydstun Loren D | $140,000 | -- |
Source: Public Records
Mortgage History
| Date | Status | Borrower | Loan Amount |
|---|---|---|---|
| Previous Owner | Boydstun Loren D | $107,200 | |
| Previous Owner | Boydstun Loren D | $120,000 |
Source: Public Records
Tax History
| Year | Tax Paid | Tax Assessment Tax Assessment Total Assessment is a certain percentage of the fair market value that is determined by local assessors to be the total taxable value of land and additions on the property. | Land | Improvement |
|---|---|---|---|---|
| 2025 | $2,253 | $520,400 | $181,300 | $339,100 |
| 2024 | $2,130 | $485,300 | $174,400 | $310,900 |
| 2023 | $2,060 | $441,200 | $158,500 | $282,700 |
| 2022 | $1,976 | $352,800 | $142,800 | $210,000 |
| 2021 | $1,842 | $305,400 | $140,000 | $165,400 |
| 2020 | $1,936 | $317,400 | $161,500 | $155,900 |
| 2019 | $1,996 | $323,500 | $184,800 | $138,700 |
| 2018 | $1,785 | $281,600 | $150,800 | $130,800 |
| 2017 | $1,793 | $291,600 | $160,800 | $130,800 |
| 2016 | $1,640 | $251,200 | $140,700 | $110,500 |
| 2015 | $1,608 | $251,200 | $140,700 | $110,500 |
| 2014 | $1,572 | $247,600 | $140,700 | $106,900 |
Source: Public Records
Map
Nearby Homes
- 59 Main St Unit 19-2
- 59 Route 6a Unit 29-4
- 59 Massachusetts 6a Unit 19-2
- 26 S West Dr
- 568 Route 6a
- 20 Bray Farm Rd S
- 268 Main St
- 15 Musket Ln
- 52 Uncle Bobs Way
- 54 Kates Path Unit 54
- 100 Kates Path Unit 100
- 118 Driftwood Ln
- 93 Stratford Ln
- 228 Kates Path
- 15 John Hall Cartway Unit 15
- 6 Thomas Ct
- 17 Margate Ln
- 129 Driftwood Ln
- 15 Signal Hill Dr
- 32 Captain Walsh Dr
Your Personal Tour Guide
Ask me questions while you tour the home.