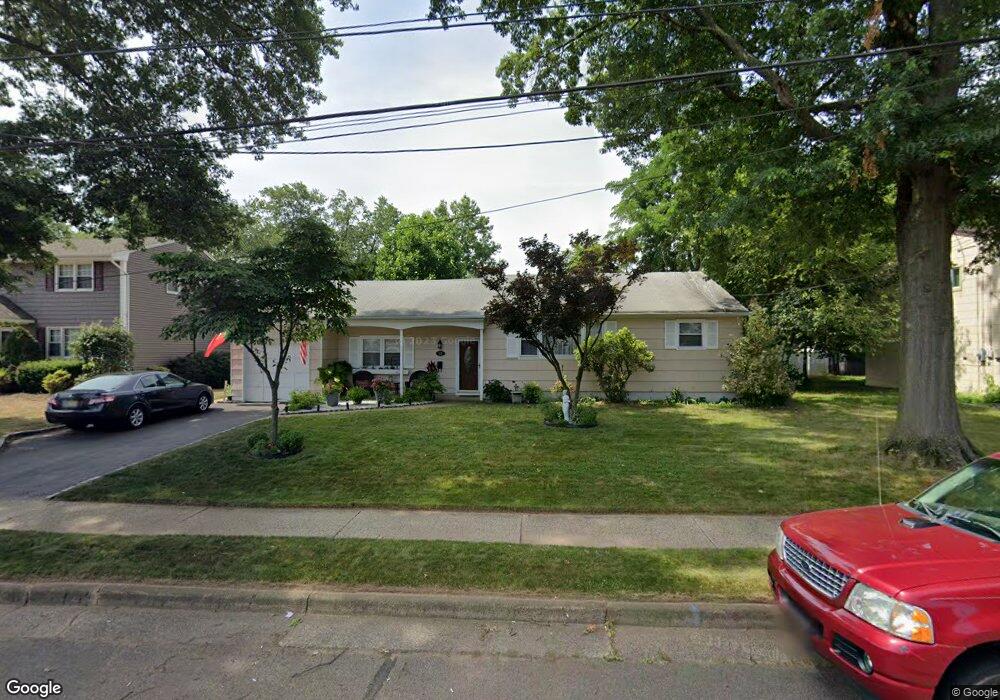
17 Princeton Dr Middlesex, NJ 08846
Estimated Value: $531,607 - $587,000
3
Beds
3
Baths
1,534
Sq Ft
$373/Sq Ft
Est. Value
About This Home
This home is located at 17 Princeton Dr, Middlesex, NJ 08846 and is currently estimated at $571,902, approximately $372 per square foot. 17 Princeton Dr is a home located in Middlesex County with nearby schools including Middlesex High School and Our Lady of Mount Virgin School.
Ownership History
Date
Name
Owned For
Owner Type
Purchase Details
Closed on
Aug 5, 2013
Sold by
Grose Ruth H
Bought by
Andrade John F and Coelho Ana M
Current Estimated Value
Home Financials for this Owner
Home Financials are based on the most recent Mortgage that was taken out on this home.
Original Mortgage
$289,132
Outstanding Balance
$215,103
Interest Rate
4.4%
Mortgage Type
FHA
Estimated Equity
$356,799
Create a Home Valuation Report for This Property
The Home Valuation Report is an in-depth analysis detailing your home's value as well as a comparison with similar homes in the area
Home Values in the Area
Average Home Value in this Area
Purchase History
| Date | Buyer | Sale Price | Title Company |
|---|---|---|---|
| Andrade John F | $296,000 | Agent For First American Tit |
Source: Public Records
Mortgage History
| Date | Status | Borrower | Loan Amount |
|---|---|---|---|
| Open | Andrade John F | $289,132 |
Source: Public Records
Tax History Compared to Growth
Tax History
| Year | Tax Paid | Tax Assessment Tax Assessment Total Assessment is a certain percentage of the fair market value that is determined by local assessors to be the total taxable value of land and additions on the property. | Land | Improvement |
|---|---|---|---|---|
| 2025 | $10,170 | $512,700 | $150,200 | $362,500 |
| 2024 | $9,682 | $439,500 | $150,200 | $289,300 |
| 2023 | $9,682 | $439,500 | $150,200 | $289,300 |
| 2022 | $10,722 | $108,400 | $38,400 | $70,000 |
| 2021 | $7,778 | $108,400 | $38,400 | $70,000 |
| 2020 | $10,213 | $108,400 | $38,400 | $70,000 |
| 2019 | $9,937 | $108,400 | $38,400 | $70,000 |
| 2018 | $9,636 | $108,400 | $38,400 | $70,000 |
| 2017 | $9,370 | $108,400 | $38,400 | $70,000 |
| 2016 | $9,061 | $108,400 | $38,400 | $70,000 |
| 2015 | $8,869 | $108,400 | $38,400 | $70,000 |
| 2014 | $8,700 | $108,400 | $38,400 | $70,000 |
Source: Public Records
Map
Nearby Homes
- 149 Mulberry Ln
- 363 Grant Ave
- 27 Shearn Dr
- 231 Fairview Ave
- 116 Greene Ave
- 310 Howard Ave
- 311 Ashland Rd
- 205 Ashland Rd
- 433 Hancock St
- 506 Melrose Ave
- 106 Farragut Ave
- 230 Oak Dr
- 515 Cook Ave
- 52 Greenbrook Rd
- 5 Wells Place
- 531 Harris Ave
- 811 Mountain Ave
- 105 Madison Ave
- 3037 King Ct
- 1891 Middlebrook Rd