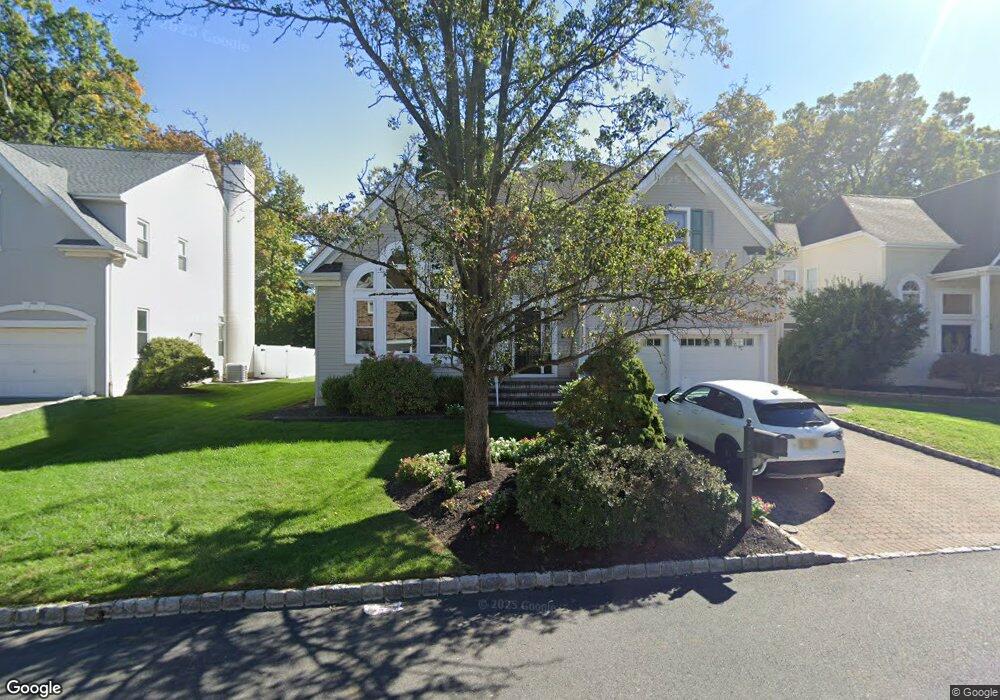
17 Rambling Dr Scotch Plains, NJ 07076
Estimated Value: $945,317 - $1,587,000
Studio
--
Bath
3,232
Sq Ft
$423/Sq Ft
Est. Value
About This Home
This home is located at 17 Rambling Dr, Scotch Plains, NJ 07076 and is currently estimated at $1,367,079, approximately $422 per square foot. 17 Rambling Dr is a home located in Union County with nearby schools including J. Ackerman Coles Elementary School, Terrill Middle School, and Scotch Plains-Fanwood High School.
Ownership History
Date
Name
Owned For
Owner Type
Purchase Details
Closed on
Dec 11, 2009
Sold by
Lyons Robin
Bought by
Nadel William D and Nadel Jennifer L
Current Estimated Value
Home Financials for this Owner
Home Financials are based on the most recent Mortgage that was taken out on this home.
Original Mortgage
$721,687
Outstanding Balance
$473,136
Interest Rate
5%
Mortgage Type
FHA
Estimated Equity
$893,943
Purchase Details
Closed on
Jul 16, 1999
Sold by
Linek Michael and Linek Eleanor
Bought by
Lyons Robin
Purchase Details
Closed on
Nov 12, 1997
Sold by
Carulli Henry A
Bought by
Linek Michael and Linek Eleanor
Home Financials for this Owner
Home Financials are based on the most recent Mortgage that was taken out on this home.
Original Mortgage
$361,250
Interest Rate
7.17%
Purchase Details
Closed on
May 9, 1994
Sold by
Carulli Henry A and Carulli Lucille A Dalbero
Bought by
Carulli Henry A
Create a Home Valuation Report for This Property
The Home Valuation Report is an in-depth analysis detailing your home's value as well as a comparison with similar homes in the area
Home Values in the Area
Average Home Value in this Area
Purchase History
We collect this data history from publicly available records. To have your information removed, we recommend requesting removal directly through your county’s website.
| Date | Buyer | Sale Price | Title Company |
|---|---|---|---|
| Nadel William D | $735,000 | None Available | |
| Lyons Robin | $465,000 | -- | |
| Linek Michael | $425,000 | Chicago Title Insurance Co | |
| Carulli Henry A | -- | -- |
Source: Public Records
Mortgage History
We collect this data history from publicly available records. To have your information removed, we recommend requesting removal directly through your county’s website.
| Date | Status | Borrower | Loan Amount |
|---|---|---|---|
| Open | Nadel William D | $721,687 | |
| Previous Owner | Linek Michael | $361,250 |
Source: Public Records
Tax History
| Year | Tax Paid | Tax Assessment Tax Assessment Total Assessment is a certain percentage of the fair market value that is determined by local assessors to be the total taxable value of land and additions on the property. | Land | Improvement |
|---|---|---|---|---|
| 2025 | $22,418 | $190,500 | $38,400 | $152,100 |
| 2024 | $21,757 | $190,500 | $38,400 | $152,100 |
| 2023 | $21,757 | $190,500 | $38,400 | $152,100 |
| 2022 | $21,498 | $190,500 | $38,400 | $152,100 |
| 2021 | $21,462 | $190,500 | $38,400 | $152,100 |
| 2020 | $21,359 | $190,500 | $38,400 | $152,100 |
| 2019 | $21,201 | $190,500 | $38,400 | $152,100 |
| 2018 | $20,845 | $190,500 | $38,400 | $152,100 |
| 2017 | $20,382 | $190,500 | $38,400 | $152,100 |
| 2016 | $19,989 | $190,500 | $38,400 | $152,100 |
| 2015 | $19,662 | $190,500 | $38,400 | $152,100 |
| 2014 | $19,014 | $190,500 | $38,400 | $152,100 |
Source: Public Records
Map
Nearby Homes
- 1822 N Gate Rd
- 504 Tillinghast Turn
- 3 Herbert Rd
- 11 Fenimore Dr
- 1317 Graymill Dr
- 1840 Raritan Rd
- 1621 Terrill Rd
- 1972 W Broad St
- 1461 Cooper Rd
- 1817 Chapel Rd
- 779 Lamberts Mill Rd
- 2041 Raritan Rd
- 1284 Woodside Rd
- 1568 Radley Rd
- 11 Allenby Ln
- 32 Fieldcrest Dr
- 7 Alton Way
- 119 Lamberts Mill Rd
- 756 Clarence St
- 794 W Broad St
Your Personal Tour Guide
Ask me questions while you tour the home.