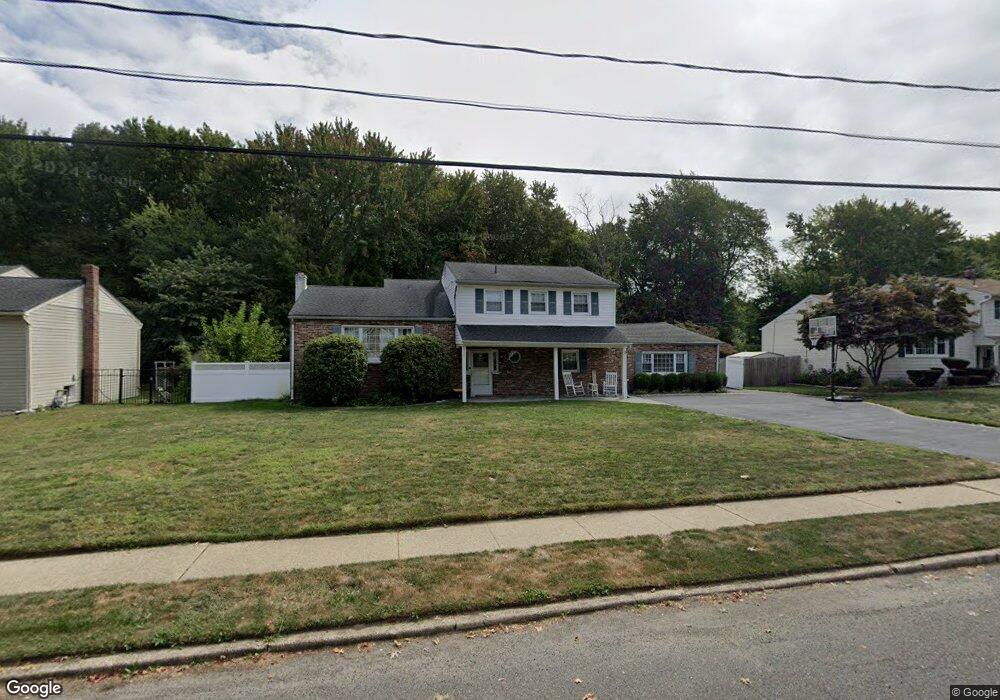
17 Ravatt Rd Port Monmouth, NJ 07758
New Monmouth NeighborhoodEstimated Value: $824,401 - $884,000
3
Beds
3
Baths
2,792
Sq Ft
$307/Sq Ft
Est. Value
About This Home
This home is located at 17 Ravatt Rd, Port Monmouth, NJ 07758 and is currently estimated at $856,100, approximately $306 per square foot. 17 Ravatt Rd is a home located in Monmouth County with nearby schools including Harmony Elementary School, Thorne Middle School, and Middletown High School North.
Ownership History
Date
Name
Owned For
Owner Type
Purchase Details
Closed on
Mar 31, 2008
Sold by
Vaubel Christopher and Vaubel Keri
Bought by
Moore Sean and Moore Lauren
Current Estimated Value
Home Financials for this Owner
Home Financials are based on the most recent Mortgage that was taken out on this home.
Original Mortgage
$390,000
Outstanding Balance
$248,206
Interest Rate
6.06%
Mortgage Type
Purchase Money Mortgage
Estimated Equity
$607,894
Purchase Details
Closed on
Jul 16, 2004
Sold by
Thorne Anne
Bought by
Vaubel Christopher
Home Financials for this Owner
Home Financials are based on the most recent Mortgage that was taken out on this home.
Original Mortgage
$320,000
Interest Rate
6.33%
Mortgage Type
Purchase Money Mortgage
Create a Home Valuation Report for This Property
The Home Valuation Report is an in-depth analysis detailing your home's value as well as a comparison with similar homes in the area
Home Values in the Area
Average Home Value in this Area
Purchase History
| Date | Buyer | Sale Price | Title Company |
|---|---|---|---|
| Moore Sean | $490,000 | Anchor Title Ag Llc | |
| Vaubel Christopher | $415,000 | -- |
Source: Public Records
Mortgage History
| Date | Status | Borrower | Loan Amount |
|---|---|---|---|
| Open | Moore Sean | $390,000 | |
| Previous Owner | Vaubel Christopher | $320,000 |
Source: Public Records
Tax History Compared to Growth
Tax History
| Year | Tax Paid | Tax Assessment Tax Assessment Total Assessment is a certain percentage of the fair market value that is determined by local assessors to be the total taxable value of land and additions on the property. | Land | Improvement |
|---|---|---|---|---|
| 2025 | $10,915 | $801,900 | $438,200 | $363,700 |
| 2024 | $10,756 | $663,500 | $306,400 | $357,100 |
| 2023 | $10,756 | $618,900 | $317,700 | $301,200 |
| 2022 | $10,737 | $602,400 | $311,100 | $291,300 |
| 2021 | $9,824 | $516,200 | $257,100 | $259,100 |
| 2020 | $9,824 | $459,500 | $206,200 | $253,300 |
| 2019 | $10,188 | $482,400 | $206,200 | $276,200 |
| 2018 | $10,174 | $469,500 | $206,200 | $263,300 |
| 2017 | $10,185 | $465,300 | $206,200 | $259,100 |
| 2016 | $9,724 | $456,300 | $199,500 | $256,800 |
| 2015 | $10,022 | $454,100 | $199,500 | $254,600 |
| 2014 | $9,781 | $432,200 | $199,500 | $232,700 |
Source: Public Records
Map
Nearby Homes