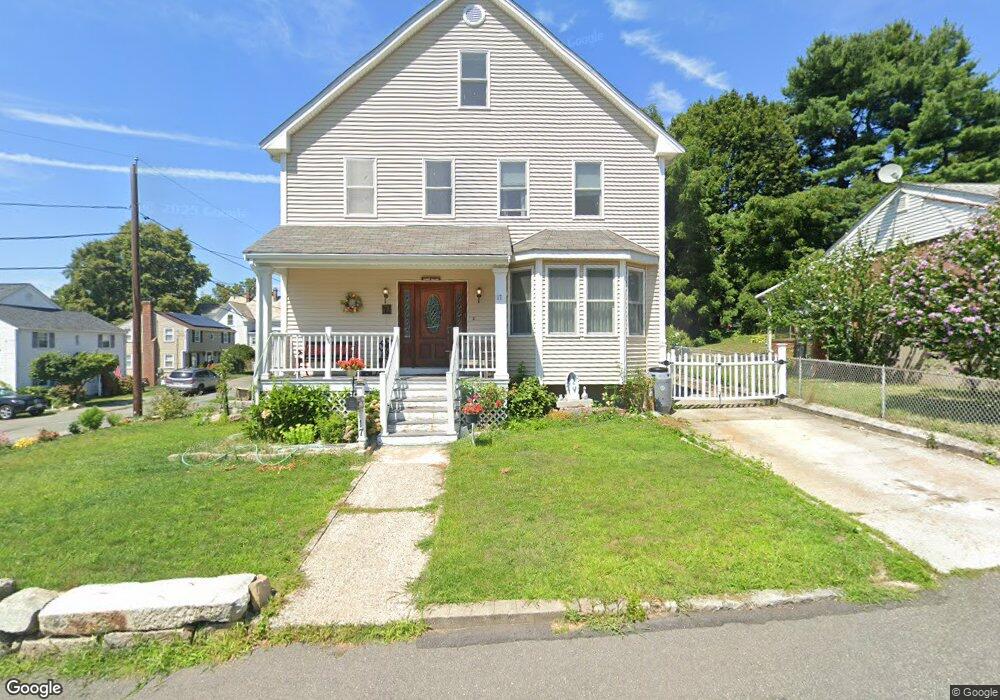
17 Reardon St Quincy, MA 02169
South Quincy NeighborhoodEstimated Value: $1,045,000 - $1,154,000
4
Beds
3
Baths
2,760
Sq Ft
$394/Sq Ft
Est. Value
About This Home
This home is located at 17 Reardon St, Quincy, MA 02169 and is currently estimated at $1,086,201, approximately $393 per square foot. 17 Reardon St is a home located in Norfolk County with nearby schools including South West Middle School, Lincoln-Hancock Community School, and Quincy High School.
Ownership History
Date
Name
Owned For
Owner Type
Purchase Details
Closed on
Oct 3, 1984
Bought by
Torres Rafael A
Current Estimated Value
Create a Home Valuation Report for This Property
The Home Valuation Report is an in-depth analysis detailing your home's value as well as a comparison with similar homes in the area
Home Values in the Area
Average Home Value in this Area
Purchase History
| Date | Buyer | Sale Price | Title Company |
|---|---|---|---|
| Torres Rafael A | $70,000 | -- |
Source: Public Records
Mortgage History
| Date | Status | Borrower | Loan Amount |
|---|---|---|---|
| Open | Torres Rafael A | $140,000 | |
| Closed | Torres Rafael A | $184,000 |
Source: Public Records
Tax History Compared to Growth
Tax History
| Year | Tax Paid | Tax Assessment Tax Assessment Total Assessment is a certain percentage of the fair market value that is determined by local assessors to be the total taxable value of land and additions on the property. | Land | Improvement |
|---|---|---|---|---|
| 2025 | $11,139 | $966,100 | $312,200 | $653,900 |
| 2024 | $10,571 | $938,000 | $297,400 | $640,600 |
| 2023 | $9,779 | $878,600 | $283,300 | $595,300 |
| 2022 | $9,790 | $817,200 | $226,600 | $590,600 |
| 2021 | $9,531 | $785,100 | $226,600 | $558,500 |
| 2020 | $9,410 | $757,000 | $226,600 | $530,400 |
| 2019 | $9,751 | $777,000 | $220,100 | $556,900 |
| 2018 | $9,310 | $697,900 | $203,800 | $494,100 |
| 2017 | $9,213 | $650,200 | $194,100 | $456,100 |
| 2016 | $8,586 | $597,900 | $176,500 | $421,400 |
| 2015 | $8,056 | $551,800 | $166,500 | $385,300 |
| 2014 | $7,955 | $535,300 | $166,500 | $368,800 |
Source: Public Records
Map
Nearby Homes
- 211 Copeland St
- 1 Cityview Ln Unit 506
- 1 Cityview Ln Unit 210
- 1 Cityview Ln Unit 709
- 46 Suomi Rd
- 46 Suomi Rd Unit 46
- 46-48 Buckley St
- 73 Connell St
- 57 Buckley St
- 25 Carrolls Ln
- 42 West St
- 10 White St
- 14 Arthur Ave
- 12 Arthur Ave
- 510 Willard St
- 21 Arthur St
- 89 Puritan Dr
- 91 Garfield St
- 64 Garfield St Unit B
- 211 West St Unit 12B