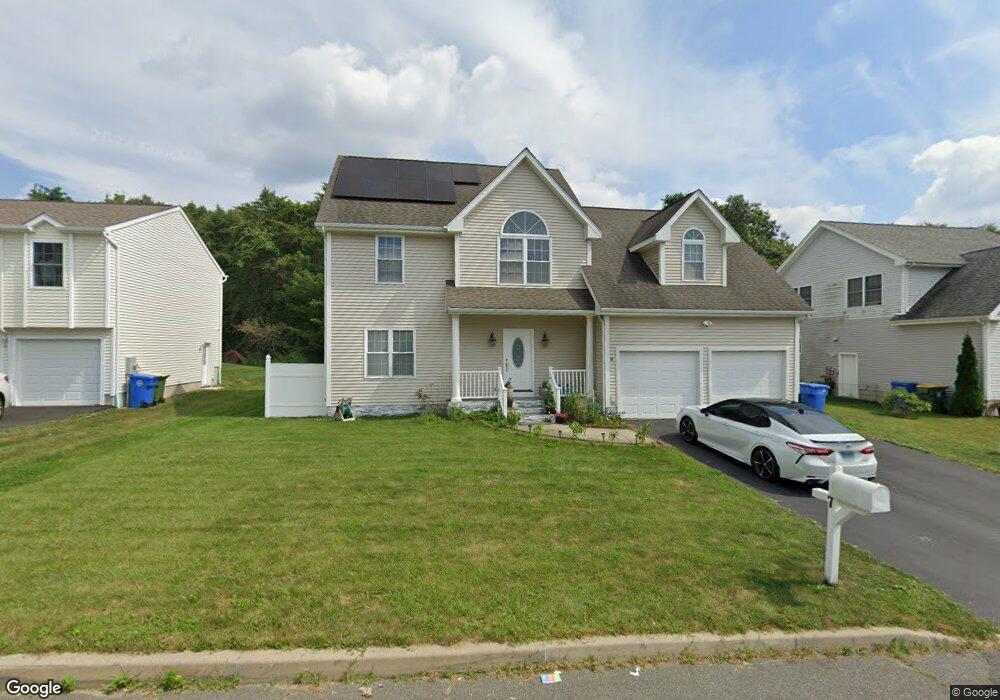
17 Red Maple Ln Waterbury, CT 06704
Bucks Hill NeighborhoodEstimated Value: $361,000 - $504,000
4
Beds
3
Baths
2,264
Sq Ft
$192/Sq Ft
Est. Value
About This Home
This home is located at 17 Red Maple Ln, Waterbury, CT 06704 and is currently estimated at $433,809, approximately $191 per square foot. 17 Red Maple Ln is a home located in New Haven County with nearby schools including Bucks Hill Elementary School, North End Middle School, and Wilby High School.
Ownership History
Date
Name
Owned For
Owner Type
Purchase Details
Closed on
Sep 29, 2011
Sold by
Usa Va
Bought by
Ahmed Ishfaq
Current Estimated Value
Home Financials for this Owner
Home Financials are based on the most recent Mortgage that was taken out on this home.
Original Mortgage
$80,000
Interest Rate
4.15%
Mortgage Type
Purchase Money Mortgage
Purchase Details
Closed on
Jun 9, 2010
Sold by
Wells Fargo Bk
Bought by
Usa Va
Purchase Details
Closed on
May 18, 2010
Sold by
Alston Michael C and Hodges Rebecca A
Bought by
Wells Fargo Bk
Purchase Details
Closed on
Jun 30, 2008
Sold by
Weinstein Mark
Bought by
Alston Michael C and Hodges Revecca A
Home Financials for this Owner
Home Financials are based on the most recent Mortgage that was taken out on this home.
Original Mortgage
$351,200
Interest Rate
6.07%
Mortgage Type
VA
Create a Home Valuation Report for This Property
The Home Valuation Report is an in-depth analysis detailing your home's value as well as a comparison with similar homes in the area
Home Values in the Area
Average Home Value in this Area
Purchase History
| Date | Buyer | Sale Price | Title Company |
|---|---|---|---|
| Ahmed Ishfaq | $137,550 | -- | |
| Usa Va | -- | -- | |
| Wells Fargo Bk | -- | -- | |
| Alston Michael C | $340,000 | -- |
Source: Public Records
Mortgage History
| Date | Status | Borrower | Loan Amount |
|---|---|---|---|
| Closed | Alston Michael C | $80,000 | |
| Previous Owner | Alston Michael C | $351,200 |
Source: Public Records
Tax History Compared to Growth
Tax History
| Year | Tax Paid | Tax Assessment Tax Assessment Total Assessment is a certain percentage of the fair market value that is determined by local assessors to be the total taxable value of land and additions on the property. | Land | Improvement |
|---|---|---|---|---|
| 2025 | $11,562 | $257,040 | $25,550 | $231,490 |
| 2024 | $12,708 | $257,040 | $25,550 | $231,490 |
| 2023 | $13,929 | $257,040 | $25,550 | $231,490 |
| 2022 | $9,877 | $164,050 | $25,520 | $138,530 |
| 2021 | $9,877 | $164,050 | $25,520 | $138,530 |
| 2020 | $9,877 | $164,050 | $25,520 | $138,530 |
| 2019 | $9,877 | $164,050 | $25,520 | $138,530 |
| 2018 | $9,877 | $164,050 | $25,520 | $138,530 |
| 2017 | $10,250 | $170,240 | $25,530 | $144,710 |
| 2016 | $10,250 | $170,240 | $25,530 | $144,710 |
| 2015 | $9,911 | $170,240 | $25,530 | $144,710 |
| 2014 | $9,911 | $170,240 | $25,530 | $144,710 |
Source: Public Records
Map
Nearby Homes
- 0 Grassy Hill Rd Unit 24070167
- 701 Bucks Hill Rd
- 713 Bucks Hill Rd
- 81 Hidden Pond Dr
- 123 Chipper Rd
- 79 Fieldstone Rd
- 12 Willowledge Cir
- 0 Rd Unit 24092160
- 267 Fieldwood Rd
- 8 Hayfield Rd
- 0 Spindle Hill Rd Unit 24062265
- 223 Bucks Hill Rd
- 13 Williams Ct
- 474 Chestnut Hill Ave
- 440 Chestnut Hill Ave
- 245 Montoe Rd
- 0 Montoe Rd
- 64 Deerwood Ln Unit 2
- 16 Oakengate Rd
- 20 Society Hill Rd
- 27 Red Maple Ln
- 7 Red Maple Ln Unit 18
- 13 Red Maple Ln
- 0 Grassy Hill Rd Unit 170127116
- 0 Grassy Hill Rd Unit W1072902
- 0 Grassy Hill Rd
- 0 Grassy Hill Rd Unit 170444864
- 20 Red Maple Ln
- 34 Red Maple Ln
- 51 Red Maple Ln
- 0 Red Maple Ln Unit G543032
- 0 Red Maple Ln Unit W1073543
- 0 Red Maple Ln Unit 15
- 39 Red Maple Ln
- 18 Red Maple Ln
- 60 Red Maple Ln
- 660 Bucks Hill Rd
- 644 Bucks Hill Rd
- 52 Red Maple Ln
- Lot 4 Red Maple Ln