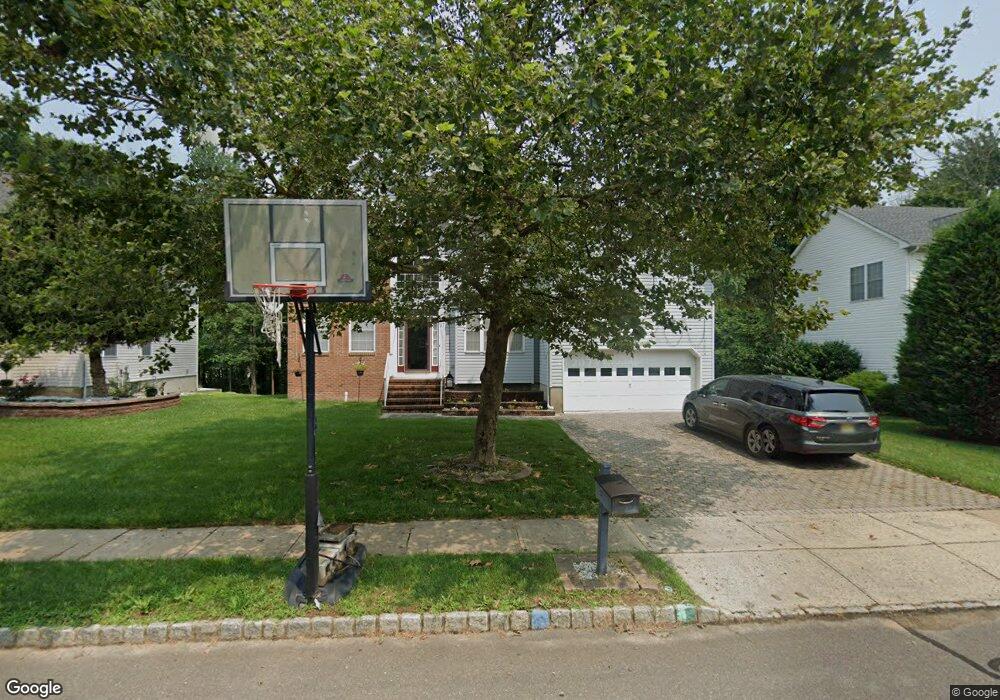
17 Revere Rd Monmouth Junction, NJ 08852
Estimated Value: $956,019 - $1,075,000
--
Bed
--
Bath
2,749
Sq Ft
$372/Sq Ft
Est. Value
About This Home
This home is located at 17 Revere Rd, Monmouth Junction, NJ 08852 and is currently estimated at $1,023,755, approximately $372 per square foot. 17 Revere Rd is a home located in Middlesex County with nearby schools including Brooks Crossing Elementary School, Crossroads North Middle School, and South Brunswick High School.
Ownership History
Date
Name
Owned For
Owner Type
Purchase Details
Closed on
Dec 22, 2017
Sold by
Chhabra Amritpal S and Chhabra Gurinder K
Bought by
Chhabra Amritpal S and Chhabra Gurinder K
Current Estimated Value
Home Financials for this Owner
Home Financials are based on the most recent Mortgage that was taken out on this home.
Original Mortgage
$4,875,000
Outstanding Balance
$4,104,323
Interest Rate
3.94%
Mortgage Type
New Conventional
Estimated Equity
-$3,080,568
Purchase Details
Closed on
Dec 19, 2003
Sold by
Crossing Deans Pond
Bought by
Chhabra Amritpal S and Kaur Gurinder
Home Financials for this Owner
Home Financials are based on the most recent Mortgage that was taken out on this home.
Original Mortgage
$382,840
Interest Rate
5.83%
Create a Home Valuation Report for This Property
The Home Valuation Report is an in-depth analysis detailing your home's value as well as a comparison with similar homes in the area
Home Values in the Area
Average Home Value in this Area
Purchase History
| Date | Buyer | Sale Price | Title Company |
|---|---|---|---|
| Chhabra Amritpal S | -- | None Available | |
| Chhabra Amritpal S | $478,550 | -- | |
| -- | $478,600 | -- |
Source: Public Records
Mortgage History
| Date | Status | Borrower | Loan Amount |
|---|---|---|---|
| Open | Chhabra Amritpal S | $4,875,000 | |
| Previous Owner | -- | $382,840 |
Source: Public Records
Tax History Compared to Growth
Tax History
| Year | Tax Paid | Tax Assessment Tax Assessment Total Assessment is a certain percentage of the fair market value that is determined by local assessors to be the total taxable value of land and additions on the property. | Land | Improvement |
|---|---|---|---|---|
| 2025 | $15,682 | $290,300 | $60,000 | $230,300 |
| 2024 | $15,119 | $290,300 | $60,000 | $230,300 |
| 2023 | $15,119 | $290,300 | $60,000 | $230,300 |
| 2022 | $14,669 | $290,300 | $60,000 | $230,300 |
| 2021 | $11,142 | $286,500 | $60,000 | $226,500 |
| 2020 | $14,566 | $286,500 | $60,000 | $226,500 |
| 2019 | $14,697 | $286,500 | $60,000 | $226,500 |
| 2018 | $13,824 | $278,600 | $60,000 | $218,600 |
| 2017 | $13,805 | $278,600 | $60,000 | $218,600 |
| 2016 | $13,660 | $278,600 | $60,000 | $218,600 |
| 2015 | $13,242 | $278,600 | $60,000 | $218,600 |
| 2014 | $13,027 | $278,600 | $60,000 | $218,600 |
Source: Public Records
Map
Nearby Homes
- 2 Tiby Place
- 21 Regal Dr
- 48 Woodland Way
- 29 Jeffrey Cir
- 147 Major Rd
- 507 S Second St
- 1401 Yarrow Cir
- 605 Dahlia Cir
- 3 Hannah Dr
- Q10 Quincy Cir Unit Q-10
- G8 Quincy Cir Unit G
- 1906 Dahlia Cir Unit 1906
- 73 Deans Ln
- 9 Kearns Place Unit 3805
- 136 Blackhorse Ln
- 10-Q Dayton Cir
- 4 Lincoln Ln Unit F4
- 8 Quincy Cir Unit G
- 1209 Blossom Cir
- 45 Hannah Dr