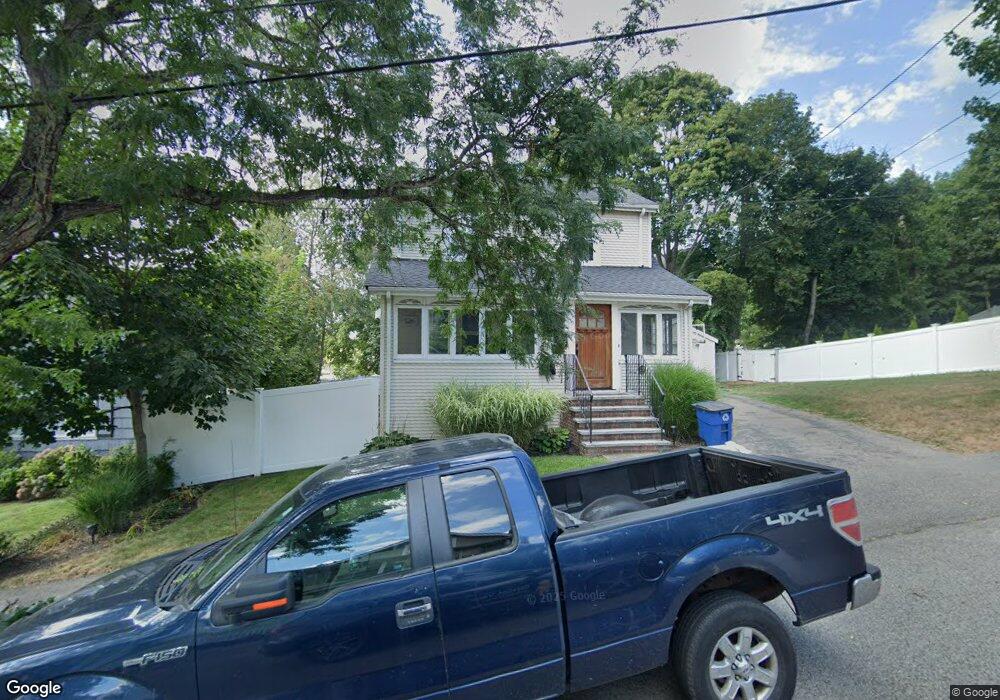
17 Richie Rd Quincy, MA 02169
South Quincy NeighborhoodEstimated Value: $670,197 - $696,000
3
Beds
2
Baths
1,489
Sq Ft
$459/Sq Ft
Est. Value
About This Home
This home is located at 17 Richie Rd, Quincy, MA 02169 and is currently estimated at $684,049, approximately $459 per square foot. 17 Richie Rd is a home located in Norfolk County with nearby schools including Lincoln-Hancock Community School, South West Middle School, and Quincy High School.
Ownership History
Date
Name
Owned For
Owner Type
Purchase Details
Closed on
Apr 1, 2004
Sold by
Sweet Stephen M
Bought by
Clifford Amy M and Clifford Gregory S
Current Estimated Value
Home Financials for this Owner
Home Financials are based on the most recent Mortgage that was taken out on this home.
Original Mortgage
$279,900
Interest Rate
5.56%
Mortgage Type
Purchase Money Mortgage
Purchase Details
Closed on
Oct 22, 1993
Sold by
Porcaro Anthony J and Porcaro Betty A
Bought by
Sweet Stephen M
Home Financials for this Owner
Home Financials are based on the most recent Mortgage that was taken out on this home.
Original Mortgage
$100,000
Interest Rate
6.73%
Mortgage Type
Purchase Money Mortgage
Create a Home Valuation Report for This Property
The Home Valuation Report is an in-depth analysis detailing your home's value as well as a comparison with similar homes in the area
Home Values in the Area
Average Home Value in this Area
Purchase History
| Date | Buyer | Sale Price | Title Company |
|---|---|---|---|
| Clifford Amy M | $349,900 | -- | |
| Sweet Stephen M | $130,000 | -- |
Source: Public Records
Mortgage History
| Date | Status | Borrower | Loan Amount |
|---|---|---|---|
| Open | Sweet Stephen M | $288,875 | |
| Closed | Clifford Amy M | $279,900 | |
| Closed | Clifford Amy M | $52,505 | |
| Previous Owner | Sweet Stephen M | $100,000 |
Source: Public Records
Tax History Compared to Growth
Tax History
| Year | Tax Paid | Tax Assessment Tax Assessment Total Assessment is a certain percentage of the fair market value that is determined by local assessors to be the total taxable value of land and additions on the property. | Land | Improvement |
|---|---|---|---|---|
| 2025 | $6,679 | $579,300 | $267,700 | $311,600 |
| 2024 | $6,316 | $560,400 | $255,000 | $305,400 |
| 2023 | $5,745 | $516,200 | $231,800 | $284,400 |
| 2022 | $5,470 | $456,600 | $193,200 | $263,400 |
| 2021 | $5,419 | $446,400 | $193,200 | $253,200 |
| 2020 | $5,231 | $420,800 | $193,200 | $227,600 |
| 2019 | $5,011 | $399,300 | $182,300 | $217,000 |
| 2018 | $4,866 | $364,800 | $168,800 | $196,000 |
| 2017 | $4,792 | $338,200 | $160,700 | $177,500 |
| 2016 | $4,396 | $306,100 | $139,800 | $166,300 |
| 2015 | $4,266 | $292,200 | $139,800 | $152,400 |
| 2014 | $4,009 | $269,800 | $139,800 | $130,000 |
Source: Public Records
Map
Nearby Homes
- 177 Franklin St
- 166 Phipps St
- 50 N Payne St Unit 1
- 50 N Payne St Unit 3
- 50 N Payne St Unit 4
- 86 Alton Rd
- 192 Federal Ave Unit B
- 8 Jackson St Unit B2
- 118 Brook Rd Unit 2
- 94 Brook Rd Unit 3
- 48 Conrad St
- 51 Brook Rd
- 33 Elm St
- 9 Independence Ave Unit 307
- 171-175 Granite St
- 106 Home Park Rd
- 347 Centre St
- 18 Cliveden St Unit 406W
- 18 Cliveden St Unit 201W
- 2 Cliveden St Unit 601E
- 21 Richie Rd
- 21 Richie Rd Unit SF
- 76 Endicott St Unit 76
- 75 Endicott St
- 74 Endicott St
- 74 Endicott St Unit A
- 18 Richie Rd
- 11 Richie Rd
- 27 Richie Rd
- 22 Richie Rd
- 22 Richie Rd Unit 1
- 24 Richie Rd
- 25 Richie Rd Unit 2
- 25 Richie Rd
- 22 - 24 Richie Rd
- 7 Richie Rd
- 7 Richie Rd Unit 2
- 7 Richie Rd Unit 1
- 70 Endicott St
- 4 Audrey St Unit 4