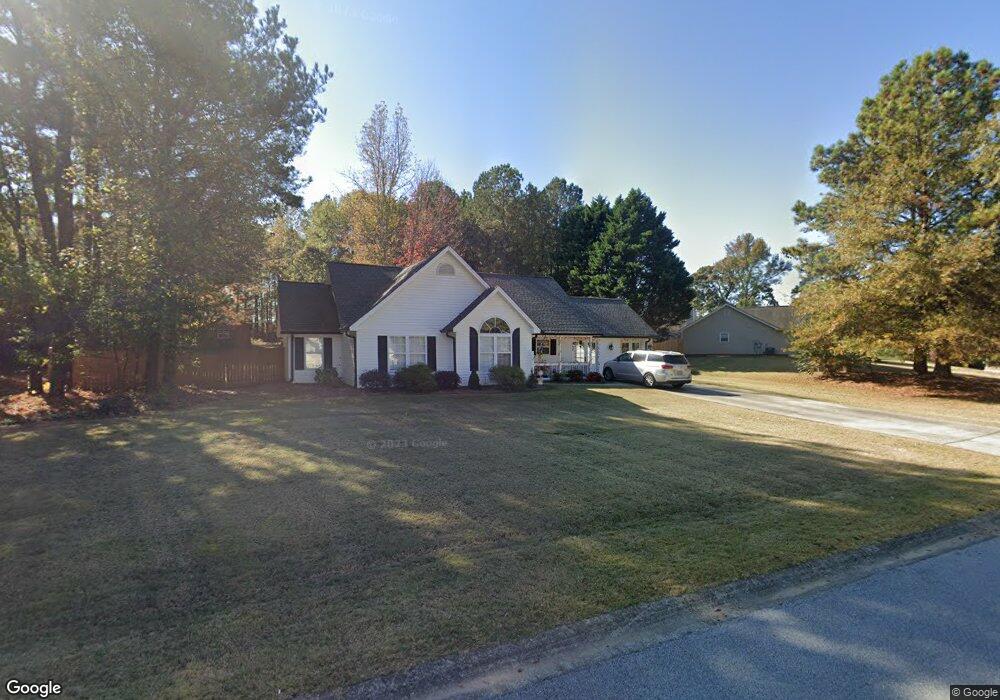
17 Ridge Way Unit 28 Braselton, GA 30517
Estimated Value: $325,000 - $366,000
3
Beds
2
Baths
1,401
Sq Ft
$247/Sq Ft
Est. Value
About This Home
This home is located at 17 Ridge Way Unit 28, Braselton, GA 30517 and is currently estimated at $345,454, approximately $246 per square foot. 17 Ridge Way Unit 28 is a home located in Jackson County with nearby schools including West Jackson Elementary School, West Jackson Middle School, and Jackson County High School.
Ownership History
Date
Name
Owned For
Owner Type
Purchase Details
Closed on
Mar 11, 2013
Sold by
Cheek Wesley James
Bought by
Young V Nicholas and Young Alison
Current Estimated Value
Purchase Details
Closed on
Jul 21, 2010
Sold by
Phillips Anthony
Bought by
Cheek Wesley James
Home Financials for this Owner
Home Financials are based on the most recent Mortgage that was taken out on this home.
Original Mortgage
$91,369
Interest Rate
4.75%
Mortgage Type
FHA
Purchase Details
Closed on
Apr 6, 2010
Sold by
Doster Patsy J
Bought by
Phillips Anthony
Purchase Details
Closed on
Feb 13, 2007
Sold by
Not Provided
Bought by
Doster Patsy J
Purchase Details
Closed on
Mar 5, 1999
Sold by
David Healan'S Signa
Bought by
Doster Patsy J
Purchase Details
Closed on
Jul 13, 1998
Sold by
Healan David
Bought by
David Healan'S Signa
Create a Home Valuation Report for This Property
The Home Valuation Report is an in-depth analysis detailing your home's value as well as a comparison with similar homes in the area
Home Values in the Area
Average Home Value in this Area
Purchase History
| Date | Buyer | Sale Price | Title Company |
|---|---|---|---|
| Young V Nicholas | $119,900 | -- | |
| Cheek Wesley James | $92,600 | -- | |
| Phillips Anthony | $46,800 | -- | |
| Doster Patsy J | -- | -- | |
| Doster Patsy J | $109,900 | -- | |
| David Healan'S Signa | $12,500 | -- |
Source: Public Records
Mortgage History
| Date | Status | Borrower | Loan Amount |
|---|---|---|---|
| Previous Owner | Cheek Wesley James | $91,369 |
Source: Public Records
Tax History Compared to Growth
Tax History
| Year | Tax Paid | Tax Assessment Tax Assessment Total Assessment is a certain percentage of the fair market value that is determined by local assessors to be the total taxable value of land and additions on the property. | Land | Improvement |
|---|---|---|---|---|
| 2024 | $2,279 | $85,400 | $24,000 | $61,400 |
| 2023 | $2,302 | $77,280 | $24,000 | $53,280 |
| 2022 | $2,016 | $65,640 | $24,000 | $41,640 |
| 2021 | $1,652 | $53,440 | $11,800 | $41,640 |
| 2020 | $1,519 | $45,120 | $11,800 | $33,320 |
| 2019 | $1,541 | $45,120 | $11,800 | $33,320 |
| 2018 | $1,505 | $43,480 | $11,800 | $31,680 |
| 2017 | $1,503 | $43,094 | $11,800 | $31,294 |
| 2016 | $1,510 | $43,094 | $11,800 | $31,294 |
| 2015 | $1,425 | $40,494 | $9,200 | $31,294 |
| 2014 | $1,119 | $32,455 | $9,200 | $23,255 |
| 2013 | -- | $30,945 | $9,200 | $21,745 |
Source: Public Records
Map
Nearby Homes
- 7068 Highway 53
- Ivy Plan at The Reserve At Liberty Park - Designer Collection
- Avery Plan at The Reserve At Liberty Park - Designer Collection
- Blair Plan at The Reserve At Liberty Park - Designer Collection
- Grandin Plan at The Reserve At Liberty Park - Designer Collection
- Wyatt Plan at The Reserve At Liberty Park - Designer Collection
- Linden Plan at The Reserve At Liberty Park - Designer Collection
- Charles Plan at The Reserve At Liberty Park - Designer Collection
- Calvin Plan at The Reserve At Liberty Park - Designer Collection
- 606 Gold Crest Dr
- 215 Hellen Valley Dr
- 1046 Madison Ave
- 916 Madison Ave
- 1590 Adams Ave
- 1413 Liberty Park Dr
- 1740 Grant Ct
- 1092 Sunny Valley Ln
- 60 Linden Ct
- 37 Linden Ct
- 310 Hunting Hills Dr
- 17 Ridge Way
- 61 Ridge Way
- 83 Ridge Way
- 83 Ridge Way Unit /26
- 311 New Liberty Church Rd
- 48 Ridge Way
- 335 New Liberty Church Rd
- 115 Ridge Way
- 76 Ridge Way
- 331 Ridge Way
- 224 New Liberty Church Rd
- 84 Ridge Way
- 383 New Liberty Church Rd
- 135 Ridge Way Unit 24
- 135 Ridge Way
- 108 Ridge Way
- 124 Ridge Way
- 227 New Liberty Church Rd
- 227 New Liberty Church Rd Unit 7
- 237 Ridge Way