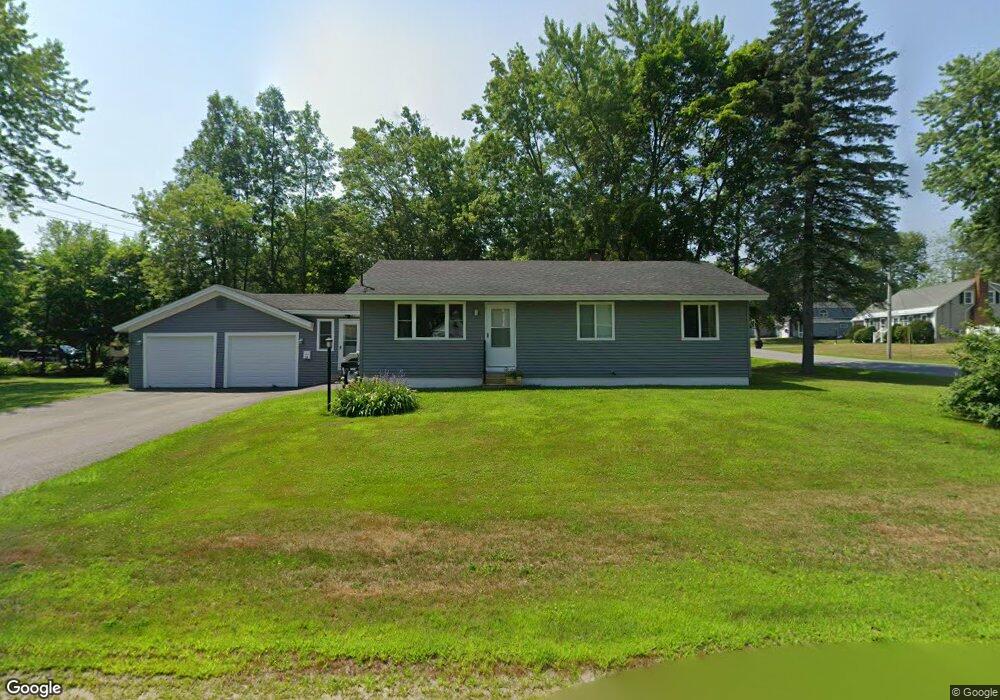
17 Roberts St Winslow, ME 04901
Estimated Value: $273,000 - $306,436
2
Beds
1
Bath
1,296
Sq Ft
$226/Sq Ft
Est. Value
About This Home
This home is located at 17 Roberts St, Winslow, ME 04901 and is currently estimated at $292,359, approximately $225 per square foot. 17 Roberts St is a home located in Kennebec County with nearby schools including Winslow Elementary School, Winslow Junior High School, and Winslow High School.
Ownership History
Date
Name
Owned For
Owner Type
Purchase Details
Closed on
Jan 24, 2025
Sold by
Grenier Paul
Bought by
Goodwin Reise and Isabelle Alana
Current Estimated Value
Home Financials for this Owner
Home Financials are based on the most recent Mortgage that was taken out on this home.
Original Mortgage
$235,000
Outstanding Balance
$232,864
Interest Rate
6.6%
Mortgage Type
Purchase Money Mortgage
Estimated Equity
$59,495
Purchase Details
Closed on
Oct 5, 2020
Sold by
Mika Elise Y
Bought by
Grenier Paul
Purchase Details
Closed on
Aug 3, 2016
Sold by
Thomas Shirley M
Bought by
Mika Elise Y
Home Financials for this Owner
Home Financials are based on the most recent Mortgage that was taken out on this home.
Original Mortgage
$84,600
Interest Rate
3.56%
Mortgage Type
New Conventional
Create a Home Valuation Report for This Property
The Home Valuation Report is an in-depth analysis detailing your home's value as well as a comparison with similar homes in the area
Home Values in the Area
Average Home Value in this Area
Purchase History
| Date | Buyer | Sale Price | Title Company |
|---|---|---|---|
| Goodwin Reise | $295,000 | None Available | |
| Goodwin Reise | $295,000 | None Available | |
| Goodwin Reise | $295,000 | None Available | |
| Grenier Paul | -- | None Available | |
| Grenier Paul | -- | None Available | |
| Grenier Paul | -- | None Available | |
| Grenier Paul | -- | None Available | |
| Mika Elise Y | -- | -- | |
| Mika Elise Y | -- | -- | |
| Mika Elise Y | -- | -- |
Source: Public Records
Mortgage History
| Date | Status | Borrower | Loan Amount |
|---|---|---|---|
| Open | Goodwin Reise | $235,000 | |
| Closed | Goodwin Reise | $235,000 | |
| Previous Owner | Mika Elise Y | $84,600 |
Source: Public Records
Tax History Compared to Growth
Tax History
| Year | Tax Paid | Tax Assessment Tax Assessment Total Assessment is a certain percentage of the fair market value that is determined by local assessors to be the total taxable value of land and additions on the property. | Land | Improvement |
|---|---|---|---|---|
| 2024 | $3,389 | $225,900 | $36,400 | $189,500 |
| 2023 | $3,389 | $225,900 | $36,400 | $189,500 |
| 2022 | $2,408 | $137,900 | $24,200 | $113,700 |
| 2021 | $2,739 | $135,600 | $24,200 | $111,400 |
| 2020 | $2,381 | $126,500 | $24,200 | $102,300 |
| 2019 | $2,358 | $126,500 | $24,200 | $102,300 |
| 2018 | $2,269 | $126,500 | $24,200 | $102,300 |
| 2017 | $2,118 | $126,500 | $24,200 | $102,300 |
| 2016 | $1,991 | $126,500 | $24,200 | $102,300 |
| 2015 | $1,961 | $126,500 | $24,200 | $102,300 |
| 2014 | $1,962 | $126,600 | $24,200 | $102,400 |
Source: Public Records
Map
Nearby Homes