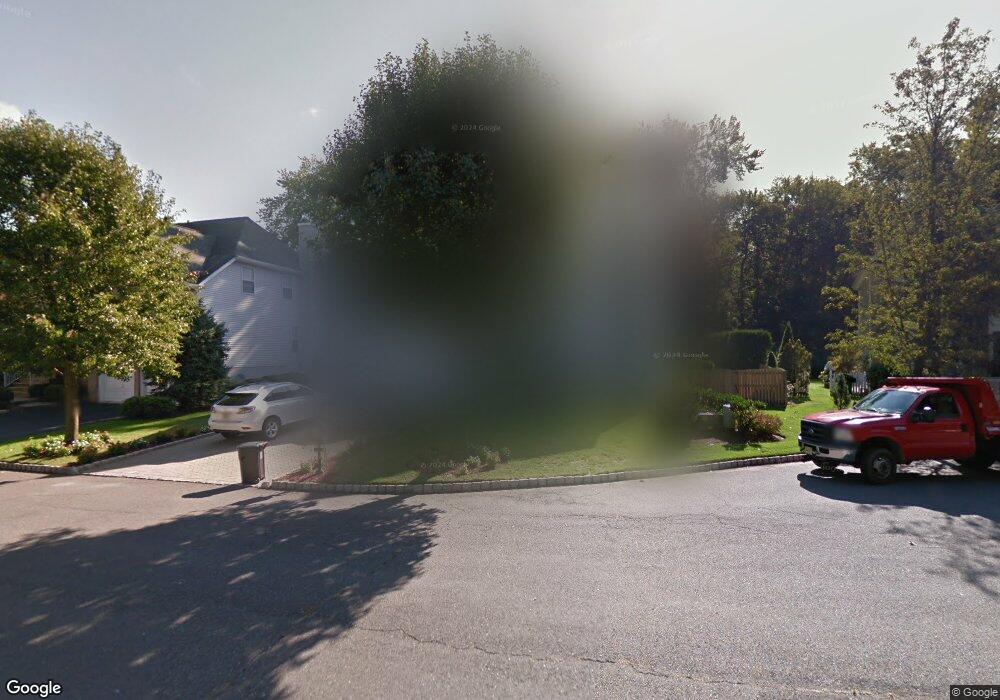
17 Robyn Ct Emerson, NJ 07630
Estimated Value: $1,111,000 - $1,260,000
4
Beds
4
Baths
2,848
Sq Ft
$410/Sq Ft
Est. Value
About This Home
This home is located at 17 Robyn Ct, Emerson, NJ 07630 and is currently estimated at $1,167,914, approximately $410 per square foot. 17 Robyn Ct is a home located in Bergen County with nearby schools including Memorial Elementary School, Patrick M. Villano Elementary School, and Emerson Jr Sr High School.
Ownership History
Date
Name
Owned For
Owner Type
Purchase Details
Closed on
Jun 27, 2013
Sold by
Garber Danny and Garber Heidi
Bought by
Silva Nelon and Silva Andrea R
Current Estimated Value
Home Financials for this Owner
Home Financials are based on the most recent Mortgage that was taken out on this home.
Original Mortgage
$585,000
Interest Rate
3.97%
Mortgage Type
New Conventional
Purchase Details
Closed on
May 17, 2006
Sold by
Frank Daniel R
Bought by
Garber Danny and Garber Hiedi
Home Financials for this Owner
Home Financials are based on the most recent Mortgage that was taken out on this home.
Original Mortgage
$700,000
Interest Rate
6.42%
Purchase Details
Closed on
Nov 30, 1995
Sold by
Town & Country Dev
Bought by
Frank Daniel and Frank Lisa
Home Financials for this Owner
Home Financials are based on the most recent Mortgage that was taken out on this home.
Original Mortgage
$275,000
Interest Rate
7.44%
Create a Home Valuation Report for This Property
The Home Valuation Report is an in-depth analysis detailing your home's value as well as a comparison with similar homes in the area
Home Values in the Area
Average Home Value in this Area
Purchase History
| Date | Buyer | Sale Price | Title Company |
|---|---|---|---|
| Silva Nelon | $735,000 | -- | |
| Garber Danny | $929,000 | -- | |
| Frank Daniel | $392,400 | -- |
Source: Public Records
Mortgage History
| Date | Status | Borrower | Loan Amount |
|---|---|---|---|
| Previous Owner | Silva Nelon | $585,000 | |
| Previous Owner | Garber Danny | $700,000 | |
| Previous Owner | Frank Daniel | $275,000 |
Source: Public Records
Tax History
| Year | Tax Paid | Tax Assessment Tax Assessment Total Assessment is a certain percentage of the fair market value that is determined by local assessors to be the total taxable value of land and additions on the property. | Land | Improvement |
|---|---|---|---|---|
| 2025 | $24,277 | $735,000 | $238,100 | $496,900 |
| 2024 | $23,638 | $735,000 | $238,100 | $496,900 |
| 2023 | $22,256 | $735,000 | $238,100 | $496,900 |
| 2022 | $22,256 | $735,000 | $238,100 | $496,900 |
| 2021 | $21,822 | $735,000 | $238,100 | $496,900 |
| 2020 | $21,396 | $735,000 | $238,100 | $496,900 |
| 2019 | $20,911 | $735,000 | $238,100 | $496,900 |
| 2018 | $19,970 | $735,000 | $238,100 | $496,900 |
| 2017 | $19,566 | $735,000 | $238,100 | $496,900 |
| 2016 | $19,139 | $735,000 | $238,100 | $496,900 |
| 2015 | $19,304 | $757,000 | $238,100 | $518,900 |
| 2014 | $18,895 | $757,000 | $238,100 | $518,900 |
Source: Public Records
Map
Nearby Homes
- 5 Linden Ave
- 75 Demarest Ave
- 922 Wildwood Rd
- 492 Oaktree Rd
- 460 Maple Ave
- 319 Franklin Place
- 97 Wortendyke Ave
- 32 W End Ave
- 719 Neill Ct
- 199 Honeysuckle Dr
- 624 West Dr
- 680 Soldier Hill Rd
- 40 3rd Ave
- 623 Alberta Dr
- 672 Rutgers Place
- 311 Walnut St
- 80 Clairmont Ave
- 330 Hickory St
- 295 Georgian Dr
- 117 Vivian Ave
Your Personal Tour Guide
Ask me questions while you tour the home.