17 Rogers Rd Cornish, ME 04020
Cornish AreaEstimated Value: $299,000 - $339,000
About This Home
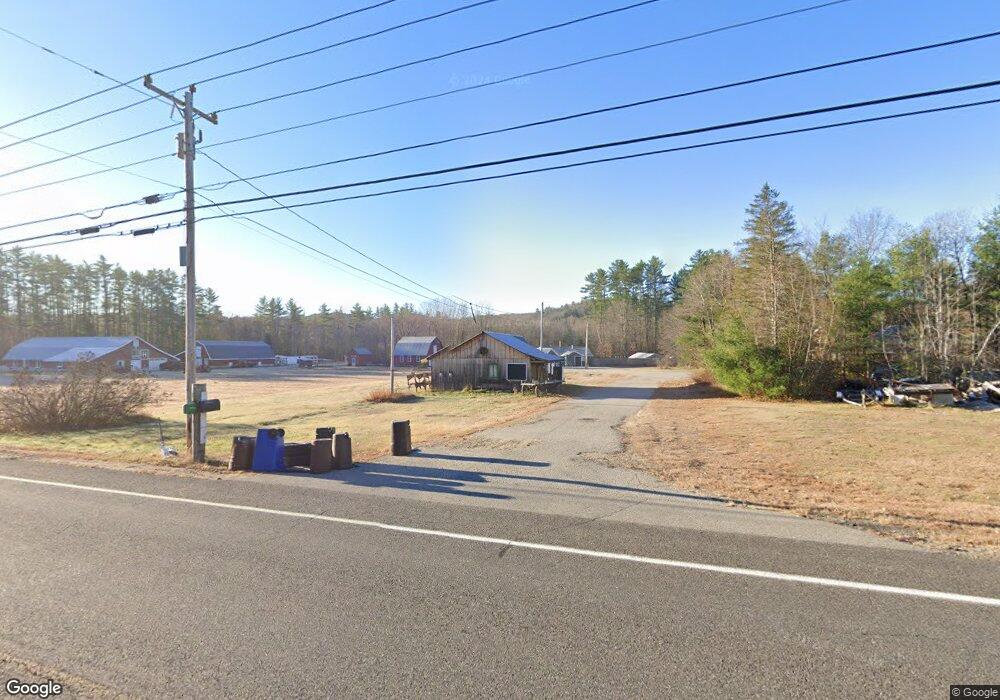
This home is located at 17 Rogers Rd, Cornish, ME 04020 and is currently estimated at $322,981, approximately $320 per square foot. 17 Rogers Rd is a home.
Ownership History
We collect this data history from publicly available records. To have your information removed, we recommend requesting removal directly through your county’s website.
Purchase Details
Purchase Details
Home Financials for this Owner
Home Financials are based on the most recent Mortgage that was taken out on this home.Purchase Details
Home Financials for this Owner
Home Financials are based on the most recent Mortgage that was taken out on this home.Purchase Details
Home Values in the Area
Average Home Value in this Area
Purchase History
We collect this data history from publicly available records. To have your information removed, we recommend requesting removal directly through your county’s website.
| Date | Buyer | Sale Price | Title Company |
|---|---|---|---|
| -- | None Available | ||
| -- | -- | ||
| -- | -- | ||
| -- | -- |
Mortgage History
We collect this data history from publicly available records. To have your information removed, we recommend requesting removal directly through your county’s website.
| Date | Status | Borrower | Loan Amount |
|---|---|---|---|
| Open | $95,000 | ||
| Previous Owner | $100,000 |
Tax History
We collect this data history from publicly available records. To have your information removed, we recommend requesting removal directly through your county’s website.
| Year | Tax Paid | Tax Assessment Tax Assessment Total Assessment is a certain percentage of the fair market value that is determined by local assessors to be the total taxable value of land and additions on the property. | Land | Improvement |
|---|---|---|---|---|
| 2025 | $2,094 | $221,600 | $79,000 | $142,600 |
| 2024 | $2,439 | $265,100 | $75,500 | $189,600 |
| 2023 | $2,361 | $165,100 | $43,300 | $121,800 |
| 2022 | $2,278 | $165,100 | $43,300 | $121,800 |
| 2021 | $2,229 | $165,100 | $43,300 | $121,800 |
| 2020 | $2,212 | $165,100 | $43,300 | $121,800 |
| 2019 | $2,212 | $165,100 | $43,300 | $121,800 |
| 2018 | $2,229 | $165,100 | $43,300 | $121,800 |
| 2016 | $2,128 | $165,100 | $43,300 | $121,800 |
| 2015 | $2,147 | $166,400 | $43,300 | $123,100 |
| 2014 | $2,208 | $171,200 | $43,300 | $127,900 |
Map
- 9 Pine Acres Dr
- 49 Circle Dr
- 92 Cumberland St
- 33 Main St
- 4 Bridge St
- Lot #11 Jordan Heights Rd
- 22 High Rd
- Lot #9 Jordan Heights Rd
- 20 Main St
- Lot #2 Jordan Heights Rd
- 167 Pound Hill Rd
- Lot #005 Senator Black Rd
- 27G Pease Hill Rd
- 96 Maple St
- 852 Pequawket Trail
- 198 Senator Black Rd
- TBD Sokokis Trail N
- 81 Pigeon Brook Rd
- 50AC Sawyer Mountain Rd
- 10-000031D Douglas Hill Rd
- 9 Rogers Rd
- 113 Harolds Way
- 50 Harolds Way
- 335 Main St
- 4 Pine Acres Dr
- 9 Pineacres Dr
- 330 Main St
- 12 Pine Acres Dr
- 347 Main St
- 302 Main St
- 19 Pine Acres Dr
- 22 Pine Acres Dr
- 350 Main St
- 29 Pine Acres Dr
- 116 Saco Woods Dr
- 0001000 Saco Woods
- 42 Harolds Way
- 32 Pine Acres Dr
- 354 Main St
- 117 Saco Woods Dr
Ask me questions while you tour the home.