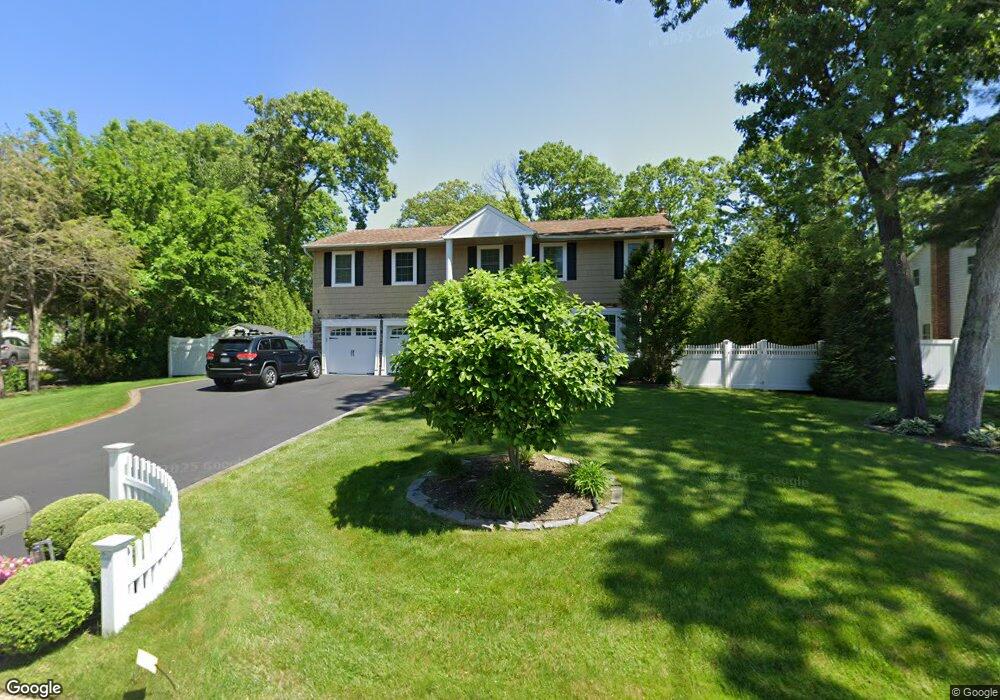
17 Ron Ct ComMacK, NY 11725
Estimated Value: $892,000 - $1,023,000
4
Beds
3
Baths
2,589
Sq Ft
$367/Sq Ft
Est. Value
About This Home
This home is located at 17 Ron Ct, ComMacK, NY 11725 and is currently estimated at $949,380, approximately $366 per square foot. 17 Ron Ct is a home located in Suffolk County with nearby schools including Hauppauge Middle School and Hauppauge High School.
Ownership History
Date
Name
Owned For
Owner Type
Purchase Details
Closed on
Feb 12, 2015
Sold by
Jurman Steven and Jurman Lori
Bought by
Hazin Eric and Hazin Rosemarie
Current Estimated Value
Home Financials for this Owner
Home Financials are based on the most recent Mortgage that was taken out on this home.
Original Mortgage
$360,000
Outstanding Balance
$262,353
Interest Rate
2.5%
Mortgage Type
New Conventional
Estimated Equity
$687,027
Purchase Details
Closed on
Aug 4, 2000
Sold by
Shah Rakesh and Shah Harshida
Bought by
Jurman Steven and Jurman Lori
Home Financials for this Owner
Home Financials are based on the most recent Mortgage that was taken out on this home.
Original Mortgage
$180,000
Interest Rate
8.06%
Purchase Details
Closed on
Apr 21, 1998
Sold by
Pfeffer Allan and Pfeffer Joyce
Bought by
Shah Rakesh and Shah Harshida
Home Financials for this Owner
Home Financials are based on the most recent Mortgage that was taken out on this home.
Original Mortgage
$216,800
Interest Rate
7.05%
Create a Home Valuation Report for This Property
The Home Valuation Report is an in-depth analysis detailing your home's value as well as a comparison with similar homes in the area
Home Values in the Area
Average Home Value in this Area
Purchase History
| Date | Buyer | Sale Price | Title Company |
|---|---|---|---|
| Hazin Eric | $497,500 | None Available | |
| Jurman Steven | $332,000 | First American Title Ins Co | |
| Shah Rakesh | $271,000 | Chicago Title Insurance Co |
Source: Public Records
Mortgage History
| Date | Status | Borrower | Loan Amount |
|---|---|---|---|
| Open | Hazin Eric | $360,000 | |
| Previous Owner | Jurman Steven | $180,000 | |
| Previous Owner | Shah Rakesh | $216,800 |
Source: Public Records
Tax History
| Year | Tax Paid | Tax Assessment Tax Assessment Total Assessment is a certain percentage of the fair market value that is determined by local assessors to be the total taxable value of land and additions on the property. | Land | Improvement |
|---|---|---|---|---|
| 2024 | $12,617 | $6,468 | $375 | $6,093 |
| 2023 | $12,617 | $6,468 | $375 | $6,093 |
| 2022 | $12,702 | $6,468 | $375 | $6,093 |
| 2021 | $12,702 | $6,468 | $375 | $6,093 |
| 2020 | $11,638 | $6,468 | $375 | $6,093 |
| 2019 | $11,638 | $0 | $0 | $0 |
| 2018 | -- | $6,468 | $375 | $6,093 |
| 2017 | $10,826 | $6,468 | $375 | $6,093 |
| 2016 | $10,769 | $7,625 | $375 | $7,250 |
| 2015 | -- | $7,625 | $375 | $7,250 |
| 2014 | -- | $7,625 | $375 | $7,250 |
Source: Public Records
Map
Nearby Homes
- 11 Edscho Ln
- 54 Valleywood Rd
- 20 Camelia Place
- 1 Shawnee Ln
- 20 Shirley Ct
- 171 Melanie Way
- 15 Orchid Ln
- 7 Seneca Dr
- 65 Lone Oak Path
- 69 Churchill Ln
- 166 Grassy Pond Dr S
- 10 Kings Park Rd
- 23 Sandy Hill Rd
- 24 Kings Park Rd
- 5 Plum Tree Ln
- 45 Harvard Ln
- 4 Whitebirch Ln
- 8 Whitebirch Ln
- 26 Whitebirch Ln
- 637 Veterans Hwy
Your Personal Tour Guide
Ask me questions while you tour the home.