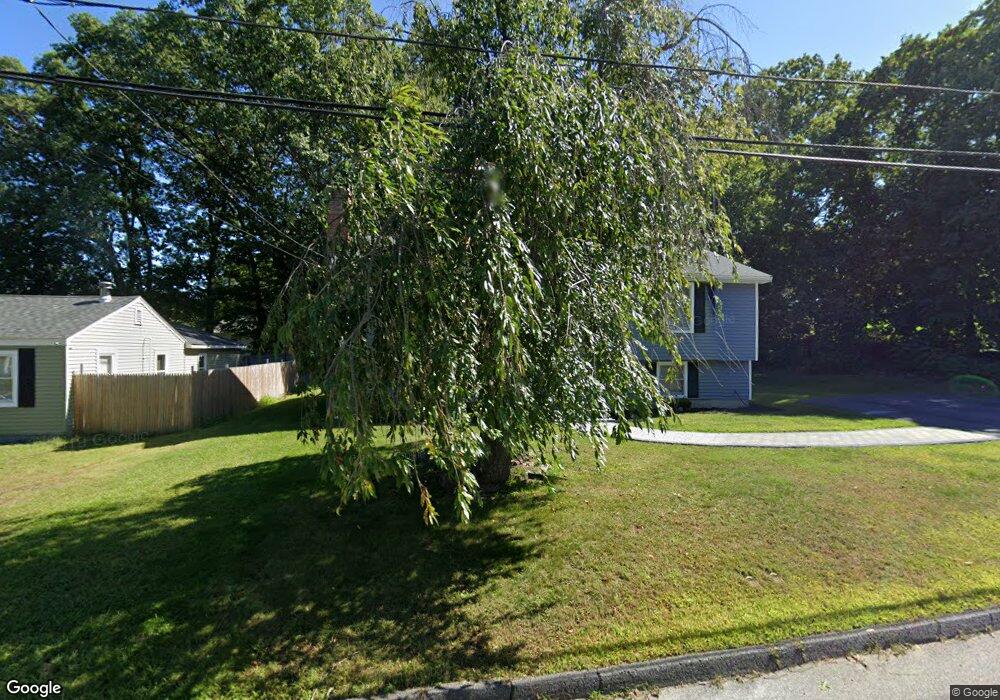
17 Rudolph St Worcester, MA 01604
Grafton Hill NeighborhoodEstimated Value: $366,000 - $394,000
2
Beds
2
Baths
1,000
Sq Ft
$384/Sq Ft
Est. Value
About This Home
This home is located at 17 Rudolph St, Worcester, MA 01604 and is currently estimated at $383,727, approximately $383 per square foot. 17 Rudolph St is a home located in Worcester County with nearby schools including Jacob Hiatt Magnet School, Chandler Magnet, and Rice Square Elementary School.
Ownership History
Date
Name
Owned For
Owner Type
Purchase Details
Closed on
Apr 5, 2024
Sold by
Jones Dorothy
Bought by
Jones Dorothy and Ngo Tho M
Current Estimated Value
Purchase Details
Closed on
Jul 13, 2017
Sold by
James Henry D and Cornerstone Bank
Bought by
Nguyen Van K
Home Financials for this Owner
Home Financials are based on the most recent Mortgage that was taken out on this home.
Original Mortgage
$106,500
Interest Rate
3.94%
Mortgage Type
New Conventional
Purchase Details
Closed on
Dec 5, 2007
Sold by
James Henry D and James Rebecca A
Bought by
James Henry D
Home Financials for this Owner
Home Financials are based on the most recent Mortgage that was taken out on this home.
Original Mortgage
$192,600
Interest Rate
6.37%
Mortgage Type
Purchase Money Mortgage
Purchase Details
Closed on
Jul 10, 1998
Sold by
Picard Robert R and Picard Wendy A
Bought by
James Henry D and James Rebecca A
Create a Home Valuation Report for This Property
The Home Valuation Report is an in-depth analysis detailing your home's value as well as a comparison with similar homes in the area
Home Values in the Area
Average Home Value in this Area
Purchase History
| Date | Buyer | Sale Price | Title Company |
|---|---|---|---|
| Jones Dorothy | -- | None Available | |
| Nguyen Van K | $142,000 | -- | |
| James Henry D | -- | -- | |
| James Henry D | $111,500 | -- |
Source: Public Records
Mortgage History
| Date | Status | Borrower | Loan Amount |
|---|---|---|---|
| Previous Owner | Nguyen Van K | $106,500 | |
| Previous Owner | James Henry D | $193,500 | |
| Previous Owner | James Henry D | $192,600 | |
| Previous Owner | James Henry D | $147,000 |
Source: Public Records
Tax History Compared to Growth
Tax History
| Year | Tax Paid | Tax Assessment Tax Assessment Total Assessment is a certain percentage of the fair market value that is determined by local assessors to be the total taxable value of land and additions on the property. | Land | Improvement |
|---|---|---|---|---|
| 2025 | $4,436 | $336,300 | $117,700 | $218,600 |
| 2024 | $4,349 | $316,300 | $117,700 | $198,600 |
| 2023 | $4,210 | $293,600 | $102,400 | $191,200 |
| 2022 | $3,702 | $243,400 | $81,900 | $161,500 |
| 2021 | $3,497 | $214,800 | $65,500 | $149,300 |
| 2020 | $3,369 | $198,200 | $65,500 | $132,700 |
| 2019 | $3,280 | $182,200 | $58,900 | $123,300 |
| 2018 | $3,309 | $175,000 | $58,900 | $116,100 |
| 2017 | $3,148 | $163,800 | $58,900 | $104,900 |
| 2016 | $3,030 | $147,000 | $42,900 | $104,100 |
| 2015 | $2,950 | $147,000 | $42,900 | $104,100 |
| 2014 | $2,872 | $147,000 | $42,900 | $104,100 |
Source: Public Records
Map
Nearby Homes
- 63 Progressive St
- 61 Progressive St
- 11 Benson St
- 11 Phoenix St
- 10 Lamar Ave
- 91 Standish St
- 53 Denver Terrace
- 83 Massasoit Rd
- 62 Allston Ave
- 55 Standish St
- 247 Pilgrim Ave
- 25 Stoneham Rd
- 4 Everton Ave
- 15 Anderson Ave
- 80 Delmont Ave
- 259 Massasoit Rd
- 340 Hamilton St
- 21 Middlesex Ave Unit 102
- 270 Sunderland Rd Unit 37
- 270 Sunderland Rd Unit 73