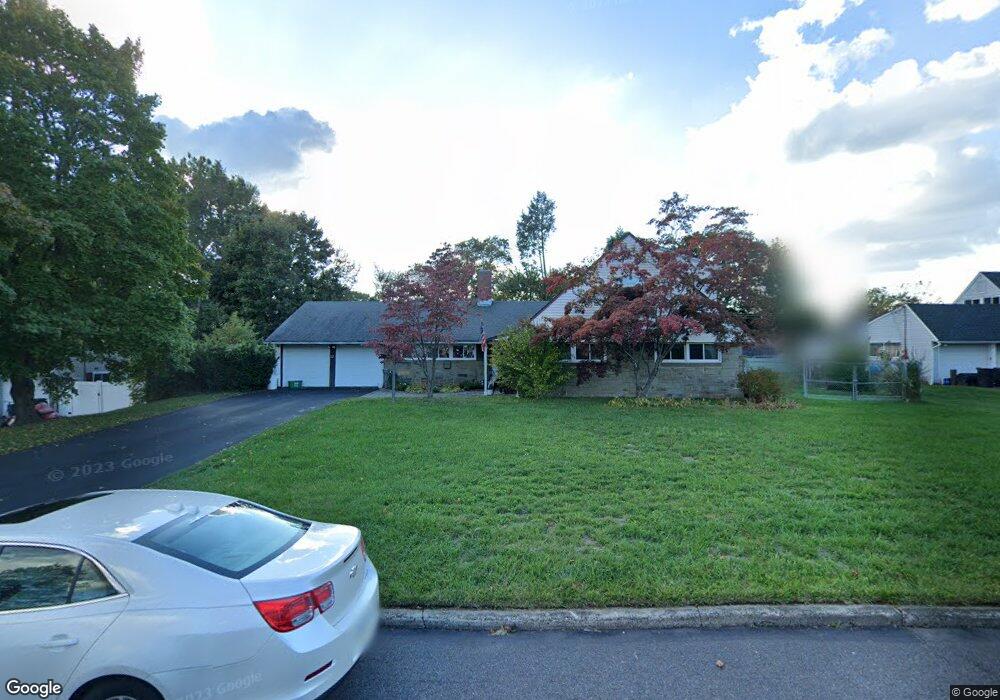
17 Rust Hill Rd Levittown, PA 19056
Red Rose Gate NeighborhoodEstimated Value: $488,000 - $556,000
4
Beds
3
Baths
2,465
Sq Ft
$213/Sq Ft
Est. Value
About This Home
This home is located at 17 Rust Hill Rd, Levittown, PA 19056 and is currently estimated at $524,747, approximately $212 per square foot. 17 Rust Hill Rd is a home located in Bucks County with nearby schools including Walter Miller Elementary School, Sandburg Middle School, and Neshaminy High School.
Ownership History
Date
Name
Owned For
Owner Type
Purchase Details
Closed on
Feb 16, 2001
Sold by
Spadiccino Gary Lee
Bought by
Spadaccino Leo and Spadaccino Edith B
Current Estimated Value
Purchase Details
Closed on
Feb 15, 2001
Sold by
Spadaccino Gary Lee and Hofmeister Dawn Jewel
Bought by
Spadaccino Gary Lee
Create a Home Valuation Report for This Property
The Home Valuation Report is an in-depth analysis detailing your home's value as well as a comparison with similar homes in the area
Home Values in the Area
Average Home Value in this Area
Purchase History
| Date | Buyer | Sale Price | Title Company |
|---|---|---|---|
| Spadaccino Leo | -- | -- | |
| Spadaccino Gary Lee | -- | -- |
Source: Public Records
Tax History
| Year | Tax Paid | Tax Assessment Tax Assessment Total Assessment is a certain percentage of the fair market value that is determined by local assessors to be the total taxable value of land and additions on the property. | Land | Improvement |
|---|---|---|---|---|
| 2025 | $6,444 | $29,600 | $6,440 | $23,160 |
| 2024 | $6,444 | $29,600 | $6,440 | $23,160 |
| 2023 | $6,342 | $29,600 | $6,440 | $23,160 |
| 2022 | $6,175 | $29,600 | $6,440 | $23,160 |
| 2021 | $6,175 | $29,600 | $6,440 | $23,160 |
| 2020 | $6,101 | $29,600 | $6,440 | $23,160 |
| 2019 | $5,965 | $29,600 | $6,440 | $23,160 |
| 2018 | $5,855 | $29,600 | $6,440 | $23,160 |
| 2017 | $5,706 | $29,600 | $6,440 | $23,160 |
| 2016 | $5,706 | $29,600 | $6,440 | $23,160 |
| 2015 | $5,895 | $29,600 | $6,440 | $23,160 |
| 2014 | $5,895 | $29,600 | $6,440 | $23,160 |
Source: Public Records
Map
Nearby Homes
- 24 Rose Apple Rd
- 194 Cobalt Ridge Dr S Unit S
- 5 June Rd
- 90 Cobalt Ridge Dr E Unit E
- 76 Cobalt Ridge Dr E Unit E
- 169 Forsythia Dr N
- 232 Forsythia Dr S Unit S
- 131 Ivy Hill Rd
- 122 Ivy Hill Rd
- 9 Harmony Rd
- 56 Indian Red Rd
- L:070 Trenton Rd
- 51 Hollybrooke Dr
- 541 Stanford Rd
- 10 Inbrook Rd
- 9 Honey Locust Rd
- 43 Petunia Rd
- 0 Fir Ave
- 77 Gaping Rock Rd
- 213 Welsford Rd
- 23 Rust Hill Rd
- 11 Rust Hill Rd
- 28 Round Hill Rd
- 24 Round Hill Rd
- 34 Round Hill Rd
- 16 Rust Hill Rd
- 22 Rust Hill Rd
- 14 Rust Hill Rd
- 29 Rust Hill Rd
- 38 Round Hill Rd
- 18 Round Hill Rd
- 8 Rust Hill Rd
- 19 Rain Lily Rd
- 29 Round Hill Rd
- 23 Rain Lily Rd
- 15 Rain Lily Rd
- 23 Round Hill Rd
- 33 Rust Hill Rd
- 35 Round Hill Rd
- 32 Rust Hill Rd
Your Personal Tour Guide
Ask me questions while you tour the home.