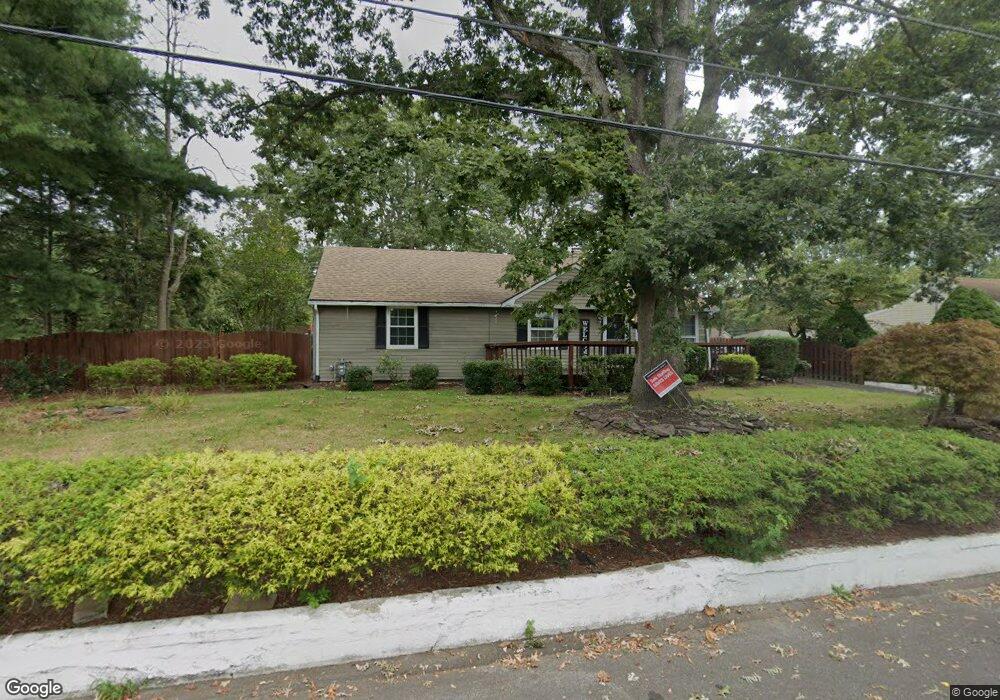
17 Rustic Dr Howell, NJ 07731
Land of Pines NeighborhoodEstimated Value: $475,000 - $573,000
3
Beds
2
Baths
1,716
Sq Ft
$308/Sq Ft
Est. Value
About This Home
This home is located at 17 Rustic Dr, Howell, NJ 07731 and is currently estimated at $528,734, approximately $308 per square foot. 17 Rustic Dr is a home located in Monmouth County with nearby schools including Land O' Pines School, Newbury School, and Howell Middle School North.
Ownership History
Date
Name
Owned For
Owner Type
Purchase Details
Closed on
Dec 13, 1999
Sold by
Knific Charles
Bought by
Negri Kenneth and Negri Dawn
Current Estimated Value
Purchase Details
Closed on
Jun 23, 1998
Sold by
Hanley Gregory
Bought by
Knific Charles and Yusko Stephanie
Home Financials for this Owner
Home Financials are based on the most recent Mortgage that was taken out on this home.
Original Mortgage
$123,000
Interest Rate
6.98%
Create a Home Valuation Report for This Property
The Home Valuation Report is an in-depth analysis detailing your home's value as well as a comparison with similar homes in the area
Home Values in the Area
Average Home Value in this Area
Purchase History
| Date | Buyer | Sale Price | Title Company |
|---|---|---|---|
| Negri Kenneth | $152,100 | -- | |
| Knific Charles | $137,500 | -- |
Source: Public Records
Mortgage History
| Date | Status | Borrower | Loan Amount |
|---|---|---|---|
| Previous Owner | Knific Charles | $123,000 |
Source: Public Records
Tax History
| Year | Tax Paid | Tax Assessment Tax Assessment Total Assessment is a certain percentage of the fair market value that is determined by local assessors to be the total taxable value of land and additions on the property. | Land | Improvement |
|---|---|---|---|---|
| 2025 | $7,730 | $473,500 | $307,200 | $166,300 |
| 2024 | $7,293 | $435,500 | $272,200 | $163,300 |
Source: Public Records
Map
Nearby Homes
Your Personal Tour Guide
Ask me questions while you tour the home.