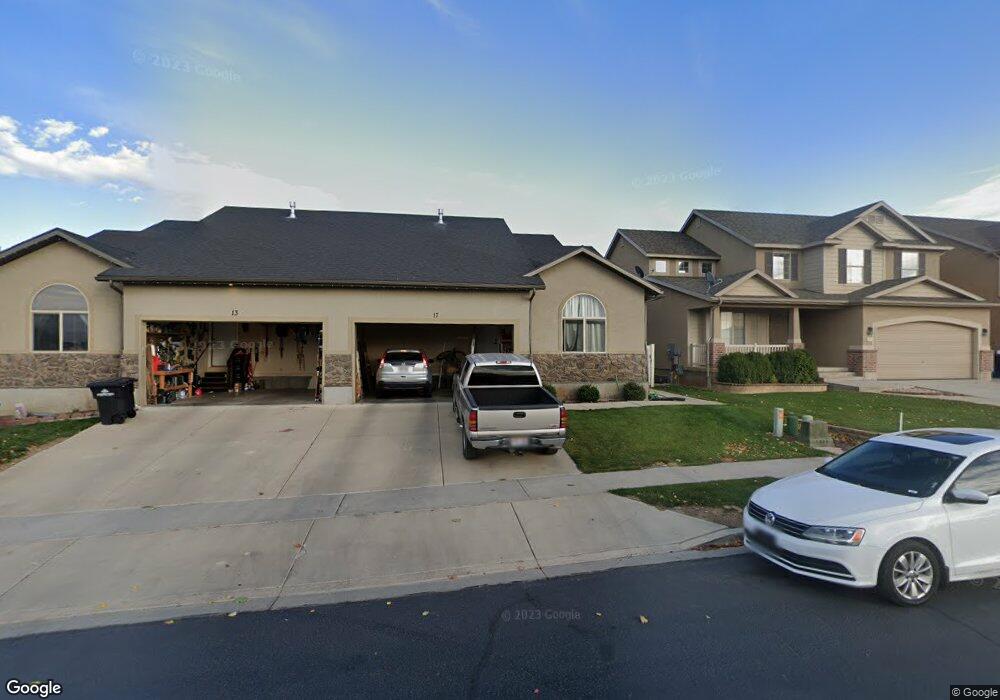
17 S 475 W Spanish Fork, UT 84660
Estimated Value: $410,655 - $471,000
4
Beds
3
Baths
2,528
Sq Ft
$172/Sq Ft
Est. Value
About This Home
This home is located at 17 S 475 W, Spanish Fork, UT 84660 and is currently estimated at $434,664, approximately $171 per square foot. 17 S 475 W is a home located in Utah County with nearby schools including Brockbank Elementary School, Spanish Fork Jr High School, and Spanish Fork High School.
Ownership History
Date
Name
Owned For
Owner Type
Purchase Details
Closed on
Jul 21, 2017
Sold by
Zajac Shea and Zajac Giuliana M
Bought by
Daggett Kenneth Robert and Daggett Jennifer
Current Estimated Value
Home Financials for this Owner
Home Financials are based on the most recent Mortgage that was taken out on this home.
Original Mortgage
$248,907
Outstanding Balance
$209,634
Interest Rate
4.4%
Mortgage Type
FHA
Estimated Equity
$225,030
Purchase Details
Closed on
Sep 26, 2008
Sold by
Tracy Petersen Homes Inc
Bought by
Zajac Shea
Home Financials for this Owner
Home Financials are based on the most recent Mortgage that was taken out on this home.
Original Mortgage
$190,516
Interest Rate
6.39%
Purchase Details
Closed on
Sep 25, 2008
Sold by
Zajac Shea
Bought by
Zajac Shea and Zajac Giuliana M
Home Financials for this Owner
Home Financials are based on the most recent Mortgage that was taken out on this home.
Original Mortgage
$190,516
Interest Rate
6.39%
Create a Home Valuation Report for This Property
The Home Valuation Report is an in-depth analysis detailing your home's value as well as a comparison with similar homes in the area
Home Values in the Area
Average Home Value in this Area
Purchase History
| Date | Buyer | Sale Price | Title Company |
|---|---|---|---|
| Daggett Kenneth Robert | -- | C&R Title Inc | |
| Zajac Shea | -- | Equity Title Orem Blvd | |
| Zajac Shea | -- | Accommodation |
Source: Public Records
Mortgage History
| Date | Status | Borrower | Loan Amount |
|---|---|---|---|
| Open | Daggett Kenneth Robert | $248,907 | |
| Previous Owner | Zajac Shea | $190,516 | |
| Previous Owner | Zajac Shea | $190,516 |
Source: Public Records
Tax History Compared to Growth
Tax History
| Year | Tax Paid | Tax Assessment Tax Assessment Total Assessment is a certain percentage of the fair market value that is determined by local assessors to be the total taxable value of land and additions on the property. | Land | Improvement |
|---|---|---|---|---|
| 2025 | $2,303 | $236,885 | $80,400 | $350,300 |
| 2024 | $2,303 | $237,380 | $0 | $0 |
| 2023 | $2,283 | $235,565 | $0 | $0 |
| 2022 | $1,960 | $198,330 | $0 | $0 |
| 2021 | $1,733 | $280,600 | $68,000 | $212,600 |
| 2020 | $1,635 | $257,400 | $68,000 | $189,400 |
| 2019 | $1,498 | $248,000 | $68,000 | $180,000 |
| 2018 | $1,427 | $228,400 | $68,000 | $160,400 |
| 2017 | $1,233 | $106,095 | $0 | $0 |
| 2016 | $1,060 | $89,980 | $0 | $0 |
| 2015 | $1,010 | $84,700 | $0 | $0 |
| 2014 | $1,006 | $84,700 | $0 | $0 |
Source: Public Records
Map
Nearby Homes
- 88 S 400 W
- 13 N 710 W
- 134 N 300 W
- 1788 N 630 St W Unit 47
- 1826 N 630 St W Unit 101
- 1841 N 630 St W Unit 71
- 294 W 200 N
- 225 W 300 S
- 2645 W 360 S Unit 1
- 2576 W 360 S Unit 5
- 833 W 250 N
- 226 N 860 W Unit 156
- 1040 W Center St
- 393 N 400 W
- 903 W 100 S
- 231 S 880 W
- 42 W 200 S
- 324 S St Unit 204
- 298 S St Unit 205
- 956 W 40 N