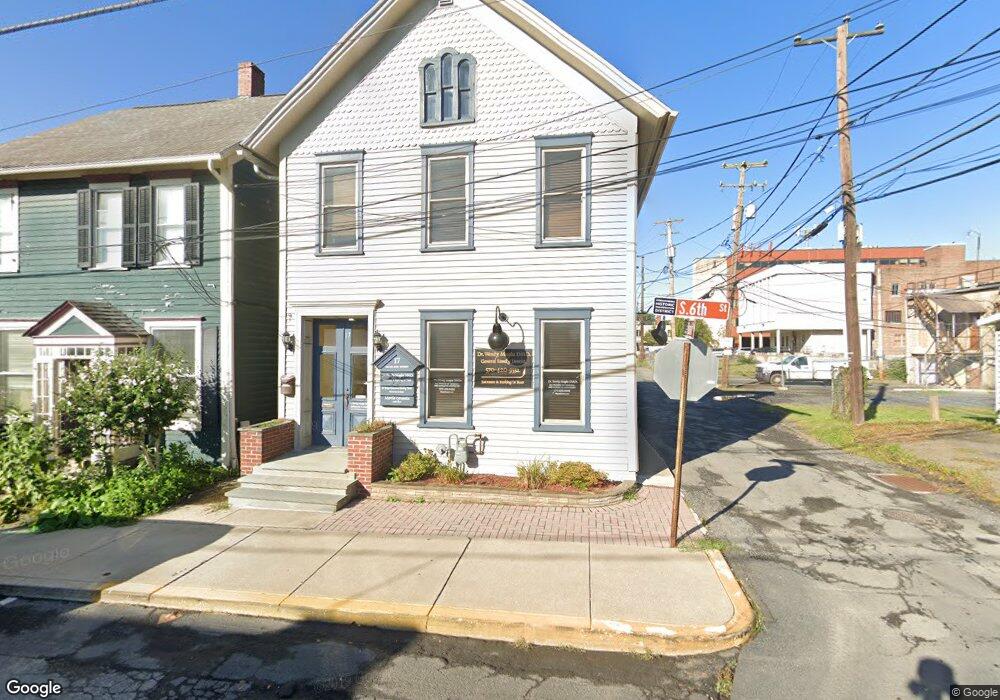
17 S 6th St Stroudsburg, PA 18360
Estimated Value: $1,143,000 - $1,249,000
3
Beds
3
Baths
3,774
Sq Ft
$316/Sq Ft
Est. Value
About This Home
This home is located at 17 S 6th St, Stroudsburg, PA 18360 and is currently estimated at $1,190,767, approximately $315 per square foot. 17 S 6th St is a home located in Monroe County with nearby schools including Stroudsburg Junior High School, Stroudsburg High School, and Stroudsburg Seventh-day Adventist School.
Ownership History
Date
Name
Owned For
Owner Type
Purchase Details
Closed on
Sep 29, 2023
Sold by
Global Hoildings Llc
Bought by
Farfalla John P
Current Estimated Value
Home Financials for this Owner
Home Financials are based on the most recent Mortgage that was taken out on this home.
Original Mortgage
$585,000
Outstanding Balance
$573,431
Interest Rate
7.09%
Mortgage Type
New Conventional
Estimated Equity
$617,336
Purchase Details
Closed on
Feb 3, 2016
Sold by
The Bank Of New York Mellon
Bought by
Global Holdings Llc
Purchase Details
Closed on
Oct 23, 2015
Sold by
Fitzgerald John
Bought by
The Bank Of New York Mellon and The Bank Of New York
Purchase Details
Closed on
Jul 9, 2007
Sold by
Fitzgerald Joan
Bought by
Fitzgerald Joan
Create a Home Valuation Report for This Property
The Home Valuation Report is an in-depth analysis detailing your home's value as well as a comparison with similar homes in the area
Home Values in the Area
Average Home Value in this Area
Purchase History
| Date | Buyer | Sale Price | Title Company |
|---|---|---|---|
| Farfalla John P | $1,185,000 | National Abstract | |
| Global Holdings Llc | $239,000 | None Available | |
| The Bank Of New York Mellon | $36,549 | None Available | |
| Fitzgerald Joan | -- | Fidelity Home Abstract |
Source: Public Records
Mortgage History
| Date | Status | Borrower | Loan Amount |
|---|---|---|---|
| Open | Farfalla John P | $585,000 |
Source: Public Records
Tax History Compared to Growth
Tax History
| Year | Tax Paid | Tax Assessment Tax Assessment Total Assessment is a certain percentage of the fair market value that is determined by local assessors to be the total taxable value of land and additions on the property. | Land | Improvement |
|---|---|---|---|---|
| 2025 | $4,248 | $532,590 | $97,160 | $435,430 |
| 2024 | $3,449 | $532,590 | $97,160 | $435,430 |
| 2023 | $13,542 | $532,590 | $97,160 | $435,430 |
| 2022 | $13,353 | $532,590 | $97,160 | $435,430 |
| 2021 | $13,353 | $532,590 | $97,160 | $435,430 |
| 2020 | $13,353 | $532,590 | $97,160 | $435,430 |
| 2019 | $10,443 | $60,810 | $12,920 | $47,890 |
| 2018 | $10,443 | $60,810 | $12,920 | $47,890 |
| 2017 | $10,565 | $60,810 | $12,920 | $47,890 |
| 2016 | $2,216 | $60,810 | $12,920 | $47,890 |
| 2015 | -- | $60,810 | $12,920 | $47,890 |
| 2014 | -- | $60,810 | $12,920 | $47,890 |
Source: Public Records
Map
Nearby Homes