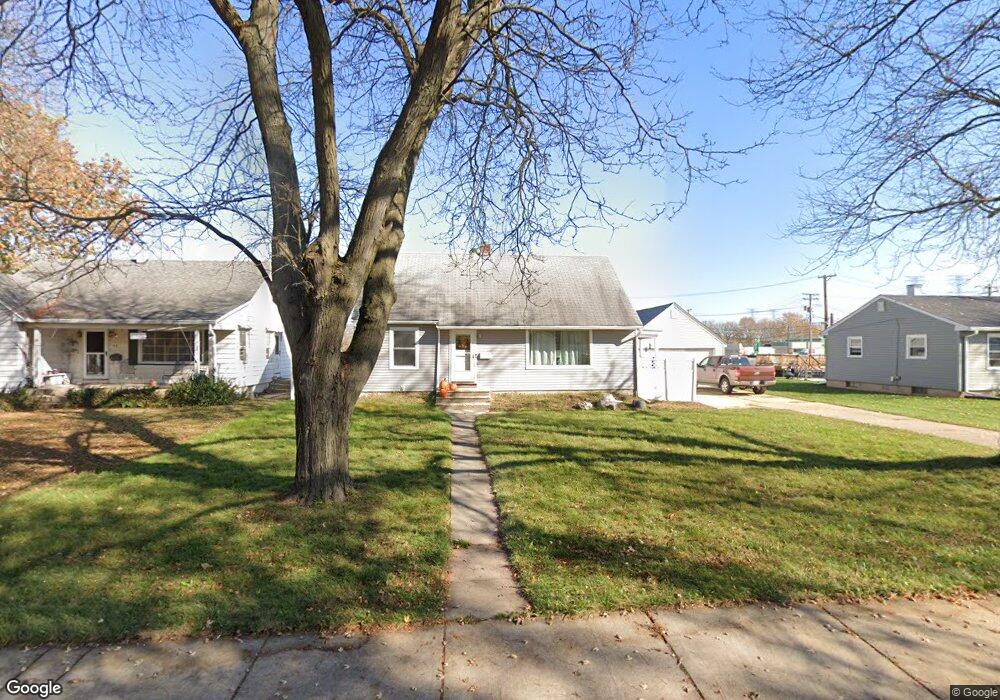
17 S Adams St North Aurora, IL 60542
Estimated Value: $269,000 - $295,000
2
Beds
2
Baths
1,500
Sq Ft
$189/Sq Ft
Est. Value
About This Home
This home is located at 17 S Adams St, North Aurora, IL 60542 and is currently estimated at $284,073, approximately $189 per square foot. 17 S Adams St is a home located in Kane County with nearby schools including Goodwin Elementary School, Jewel Middle School, and West Aurora High School.
Ownership History
Date
Name
Owned For
Owner Type
Purchase Details
Closed on
Jun 28, 2010
Sold by
Melvin Jennifer Ann and Tuman Jennifer Ann
Bought by
Unold Nicklas and Unold Sarah M
Current Estimated Value
Home Financials for this Owner
Home Financials are based on the most recent Mortgage that was taken out on this home.
Original Mortgage
$152,940
Outstanding Balance
$105,513
Interest Rate
5.5%
Mortgage Type
FHA
Estimated Equity
$178,560
Purchase Details
Closed on
Sep 7, 2007
Sold by
Petersen Gary R and Lindenmeyer Janice M
Bought by
Tuman Jennifer Ann
Home Financials for this Owner
Home Financials are based on the most recent Mortgage that was taken out on this home.
Original Mortgage
$158,525
Interest Rate
6.63%
Mortgage Type
New Conventional
Purchase Details
Closed on
Feb 24, 2005
Sold by
Petersen Richard W
Bought by
Lindenmeyer Janice M and Petersen Gary R
Create a Home Valuation Report for This Property
The Home Valuation Report is an in-depth analysis detailing your home's value as well as a comparison with similar homes in the area
Home Values in the Area
Average Home Value in this Area
Purchase History
| Date | Buyer | Sale Price | Title Company |
|---|---|---|---|
| Unold Nicklas | $155,000 | First American Title | |
| Tuman Jennifer Ann | $186,500 | Greater Illinois Title Co | |
| Lindenmeyer Janice M | -- | -- |
Source: Public Records
Mortgage History
| Date | Status | Borrower | Loan Amount |
|---|---|---|---|
| Open | Unold Nicklas | $152,940 | |
| Previous Owner | Tuman Jennifer Ann | $158,525 |
Source: Public Records
Tax History Compared to Growth
Tax History
| Year | Tax Paid | Tax Assessment Tax Assessment Total Assessment is a certain percentage of the fair market value that is determined by local assessors to be the total taxable value of land and additions on the property. | Land | Improvement |
|---|---|---|---|---|
| 2024 | $5,005 | $73,766 | $15,912 | $57,854 |
| 2023 | $4,773 | $65,909 | $14,217 | $51,692 |
| 2022 | $4,536 | $60,136 | $12,972 | $47,164 |
| 2021 | $4,317 | $55,987 | $12,077 | $43,910 |
| 2020 | $4,391 | $55,902 | $11,218 | $44,684 |
| 2019 | $4,237 | $51,795 | $10,394 | $41,401 |
| 2018 | $4,080 | $48,632 | $9,614 | $39,018 |
| 2017 | $3,693 | $43,504 | $8,858 | $34,646 |
| 2016 | $3,299 | $38,494 | $7,593 | $30,901 |
| 2015 | -- | $37,143 | $6,529 | $30,614 |
| 2014 | -- | $36,243 | $6,279 | $29,964 |
| 2013 | -- | $35,728 | $6,190 | $29,538 |
Source: Public Records
Map
Nearby Homes
- 16 S Grace St
- 12 N Lincolnway
- 306 Harmony Dr
- 307 John St
- 925 Darwin St
- 320 Harmony Dr
- 24 S Grant St
- 148 N Lincolnway
- 122 E State St
- 218 Timber Oaks Dr
- 202 Larchwood Ln
- 6 S Sycamore Ln
- 503 Redwood Ct
- 302 Pin Oak Dr
- 203 Lilac Ln
- 344 Hilltop Dr
- 202 Linn Ct Unit C
- 341 Pheasant Hill Dr
- 114 Briar Ln Unit 2
- 427 Prairie Ridge Ln
- 15 S Adams St
- 13 S Adams St
- 18 S Lincolnway
- 24 S Lincolnway
- 18 S Adams St
- 14 S Lincolnway
- 20 S Adams St
- 16 S Adams St
- 11 S Adams St
- 14 S Adams St
- 10 S Lincolnway
- 108 John St
- 108 John St Unit 2B-C
- 108 John St Unit 2A-B-C
- 108 John St Unit 2A-B
- 108 John St Unit 2E
- 108 John St Unit 2C
- 108 John St Unit 2B
- 108 John St Unit 2A
- 108 John St Unit 1B