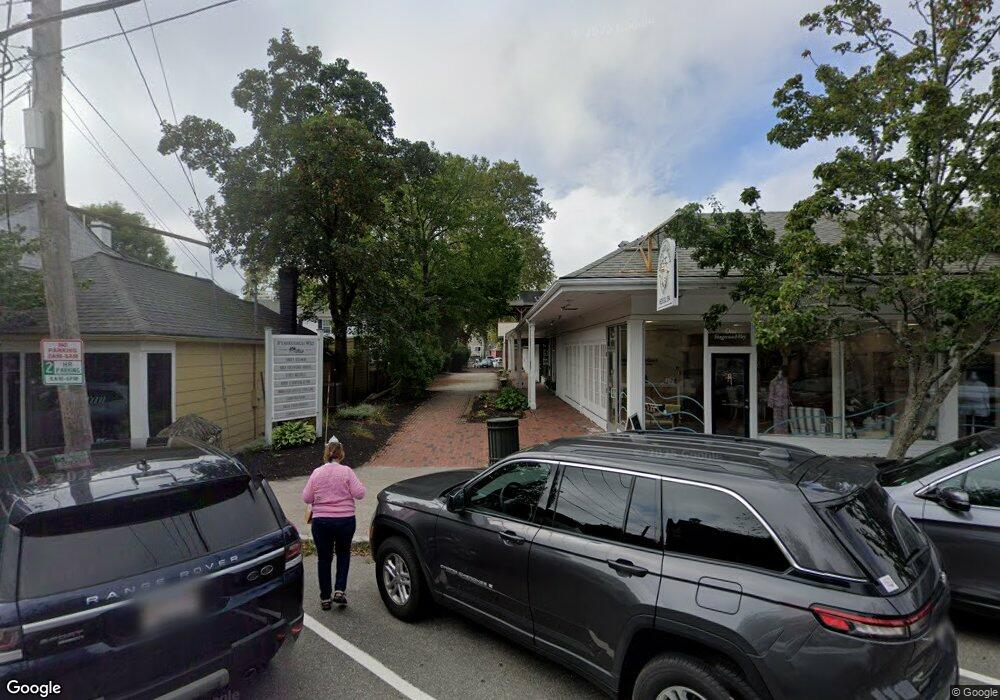
17 S Main St Cohasset, MA 02025
Estimated Value: $586,114
--
Bed
1
Bath
800
Sq Ft
$733/Sq Ft
Est. Value
About This Home
This home is located at 17 S Main St, Cohasset, MA 02025 and is currently estimated at $586,114, approximately $732 per square foot. 17 S Main St is a home located in Norfolk County with nearby schools including Joseph Osgood School, Deer Hill School, and Cohasset Middle School.
Ownership History
Date
Name
Owned For
Owner Type
Purchase Details
Closed on
Sep 23, 2025
Sold by
Young Belford Llc
Bought by
Hocoh Llc
Current Estimated Value
Purchase Details
Closed on
Oct 15, 2018
Sold by
Kirkendall South Main and Kirkendall
Bought by
Young Belford Llc
Home Financials for this Owner
Home Financials are based on the most recent Mortgage that was taken out on this home.
Original Mortgage
$190,000
Interest Rate
4.5%
Mortgage Type
New Conventional
Purchase Details
Closed on
Oct 30, 2007
Sold by
Kirkendall Karen L
Bought by
Kirkendall South Main and Kirkendall
Purchase Details
Closed on
Dec 8, 2003
Sold by
Grechen Vincent J
Bought by
Kirkendall Karen L
Purchase Details
Closed on
May 14, 1997
Sold by
Stonge Tr Barbara H and Stonge Tr David W
Bought by
Grechen Vincent
Home Financials for this Owner
Home Financials are based on the most recent Mortgage that was taken out on this home.
Original Mortgage
$97,500
Interest Rate
8.12%
Mortgage Type
Commercial
Purchase Details
Closed on
Aug 30, 1996
Sold by
Boyden Harold E
Bought by
Stonge Barbara H and St Onge David W
Purchase Details
Closed on
Nov 23, 1993
Sold by
Hand John
Bought by
Boyden Harold E
Create a Home Valuation Report for This Property
The Home Valuation Report is an in-depth analysis detailing your home's value as well as a comparison with similar homes in the area
Home Values in the Area
Average Home Value in this Area
Purchase History
| Date | Buyer | Sale Price | Title Company |
|---|---|---|---|
| Hocoh Llc | $446,500 | -- | |
| Young Belford Llc | $375,000 | -- | |
| Young Belford Llc | $375,000 | -- | |
| Kirkendall South Main | -- | -- | |
| Kirkendall South Main | -- | -- | |
| Kirkendall Karen L | $299,500 | -- | |
| Kirkendall Karen L | $299,500 | -- | |
| Grechen Vincent | $130,000 | -- | |
| Grechen Vincent | $130,000 | -- | |
| Stonge Barbara H | $119,000 | -- | |
| Stonge Barbara H | $119,000 | -- | |
| Boyden Harold E | $93,000 | -- | |
| Boyden Harold E | $93,000 | -- |
Source: Public Records
Mortgage History
| Date | Status | Borrower | Loan Amount |
|---|---|---|---|
| Previous Owner | Young Belford Llc | $190,000 | |
| Previous Owner | Boyden Harold E | $97,500 |
Source: Public Records
Tax History Compared to Growth
Tax History
| Year | Tax Paid | Tax Assessment Tax Assessment Total Assessment is a certain percentage of the fair market value that is determined by local assessors to be the total taxable value of land and additions on the property. | Land | Improvement |
|---|---|---|---|---|
| 2025 | $4,007 | $346,000 | $191,800 | $154,200 |
| 2024 | $4,246 | $348,900 | $191,800 | $157,100 |
| 2023 | $4,117 | $348,900 | $191,800 | $157,100 |
| 2022 | $4,238 | $337,400 | $187,200 | $150,200 |
| 2021 | $4,451 | $341,300 | $187,200 | $154,100 |
| 2020 | $4,427 | $341,300 | $187,200 | $154,100 |
| 2019 | $4,131 | $320,200 | $187,200 | $133,000 |
| 2018 | $4,095 | $320,200 | $187,200 | $133,000 |
| 2017 | $4,054 | $310,400 | $184,000 | $126,400 |
| 2016 | $3,998 | $310,400 | $184,000 | $126,400 |
| 2015 | $3,945 | $310,400 | $184,000 | $126,400 |
| 2014 | $3,822 | $304,800 | $178,400 | $126,400 |
Source: Public Records
Map
Nearby Homes
- 128 Elm St Unit 211
- 89 Ripley Rd
- 11 Beach St
- 15 Cushing Rd
- 21-23 Elm Ct
- 26 Ash St
- 87 Elm St Unit 215
- 4 Margin St Unit A
- 124 Elm St Unit 202
- 124 Elm St Unit 308
- 25 Ripley Rd
- 40 Pond St
- 73 Pond St
- 146 N Main St Unit 146
- 135 Beach St
- 98 Black Horse Ln
- 119 Pleasant St
- 212 S Main St
- 25 Mohawk Way
- 17 Mohawk Way
- 5 Stagecoach Way
- 7 S Main St
- 24 S Main St Unit 1
- 24 S Main St
- 27 S Main St Unit 31
- 31 S Main St Unit 31
- 31 S Main St Unit 1
- 31 S Main St Unit B
- 2 S Main St
- 12 Parkingway Unit Upper Level
- 12 Parkingway Unit Lower Level
- 12 Parkingway
- 000 Elm St Unit 2
- 00 Elm St Unit 2
- 7 Depot Ct Unit 4
- 7 Depot Ct Unit 5
- 7 Depot Ct
- 1-5 S Main St Unit 5
- 1-5 S Main St
- 5 S Main St