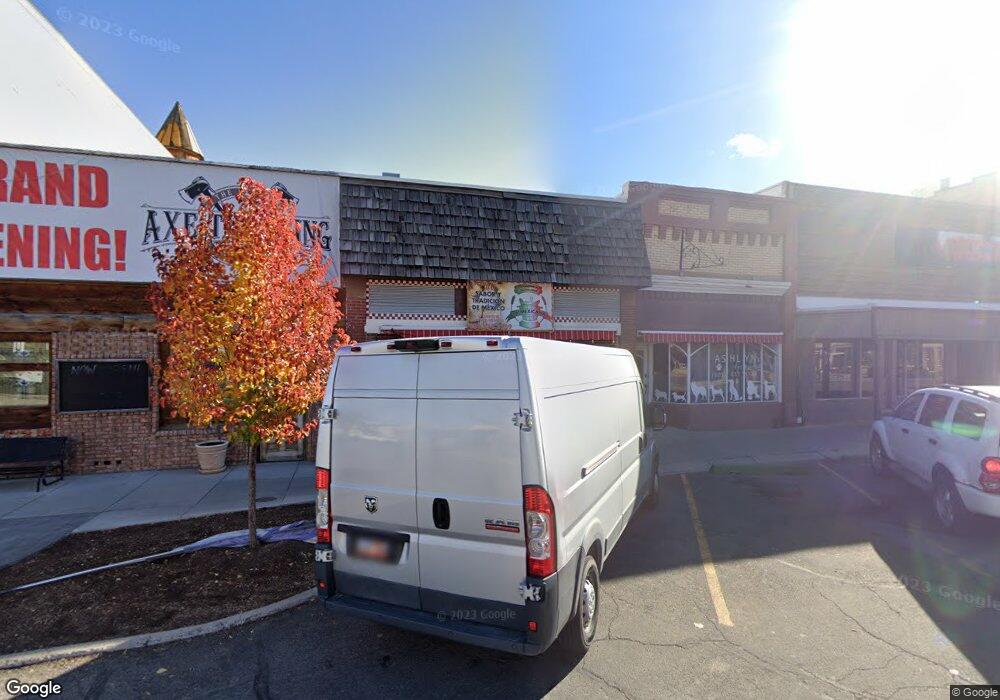
17 S Main St Payson, UT 84651
Studio
--
Bath
3,048
Sq Ft
5,663
Sq Ft Lot
About This Home
This home is located at 17 S Main St, Payson, UT 84651. 17 S Main St is a home located in Utah County with nearby schools including Park View Elementary, Payson Junior High School, and Payson High School.
Ownership History
Date
Name
Owned For
Owner Type
Purchase Details
Closed on
Feb 5, 2024
Sold by
Blackhawk Partners and Re Lube Llc
Bought by
Pgp Investments Llc
Purchase Details
Closed on
Feb 9, 2022
Sold by
Dtc Payson Llc
Bought by
Re Lube Llc
Purchase Details
Closed on
Mar 21, 2017
Sold by
Bar T Holdings I Llc
Bought by
Dtc Payson Llc
Home Financials for this Owner
Home Financials are based on the most recent Mortgage that was taken out on this home.
Original Mortgage
$101,500
Interest Rate
4.4%
Mortgage Type
Commercial
Purchase Details
Closed on
Nov 30, 2006
Sold by
Taylor Gordon
Bought by
Bar T Holdings I Llc
Purchase Details
Closed on
Dec 30, 2004
Sold by
Taylor Gordon
Bought by
Taylor Gordon
Create a Home Valuation Report for This Property
The Home Valuation Report is an in-depth analysis detailing your home's value as well as a comparison with similar homes in the area
Home Values in the Area
Average Home Value in this Area
Purchase History
| Date | Buyer | Sale Price | Title Company |
|---|---|---|---|
| Pgp Investments Llc | -- | Prospect Title | |
| Re Lube Llc | -- | Prospect Land Title | |
| Dtc Payson Llc | -- | Inwest Title | |
| Bar T Holdings I Llc | -- | None Available | |
| Taylor Gordon | -- | -- |
Source: Public Records
Mortgage History
| Date | Status | Borrower | Loan Amount |
|---|---|---|---|
| Previous Owner | Dtc Payson Llc | $101,500 |
Source: Public Records
Tax History
| Year | Tax Paid | Tax Assessment Tax Assessment Total Assessment is a certain percentage of the fair market value that is determined by local assessors to be the total taxable value of land and additions on the property. | Land | Improvement |
|---|---|---|---|---|
| 2025 | $2,698 | $360,300 | $248,800 | $111,500 |
| 2024 | $2,698 | $274,600 | $0 | $0 |
| 2023 | $2,289 | $233,600 | $0 | $0 |
| 2022 | $2,339 | $234,800 | $146,100 | $88,700 |
| 2021 | $2,004 | $177,400 | $106,400 | $71,000 |
| 2020 | $2,162 | $187,300 | $96,600 | $90,700 |
| 2019 | $1,961 | $174,200 | $82,900 | $91,300 |
| 2018 | $1,833 | $156,900 | $79,700 | $77,200 |
| 2017 | $1,839 | $153,900 | $0 | $0 |
| 2016 | $1,806 | $150,200 | $0 | $0 |
| 2015 | $1,785 | $147,400 | $0 | $0 |
| 2014 | $1,741 | $144,800 | $0 | $0 |
Source: Public Records
Map
Nearby Homes
Your Personal Tour Guide
Ask me questions while you tour the home.