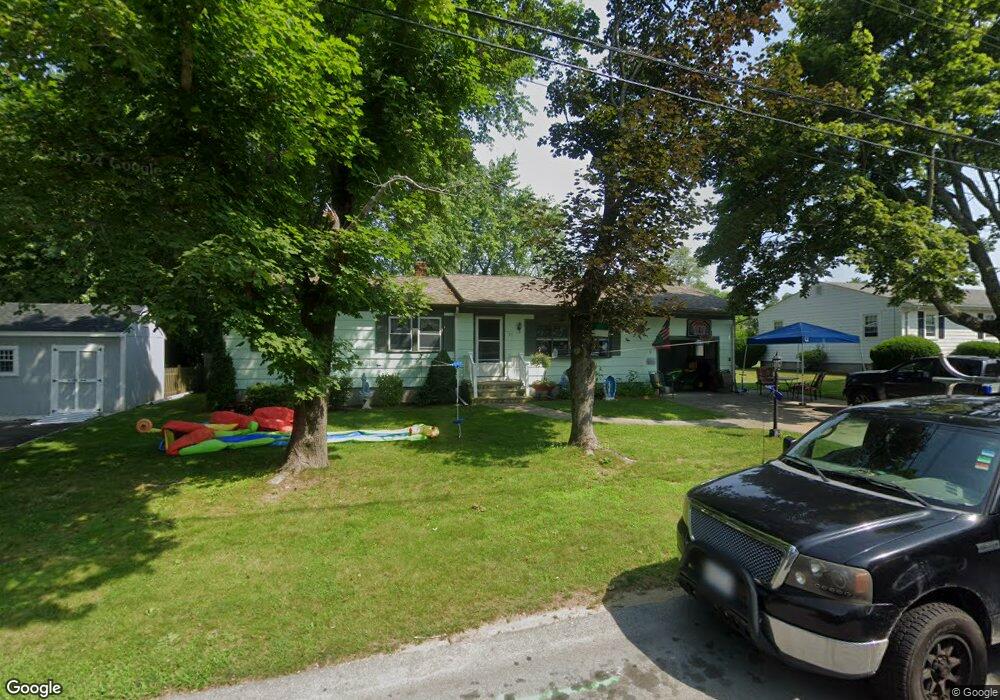
17 Sable Ave North Dartmouth, MA 02747
Idlewood NeighborhoodEstimated Value: $477,571 - $482,000
3
Beds
1
Bath
1,196
Sq Ft
$401/Sq Ft
Est. Value
About This Home
This home is located at 17 Sable Ave, North Dartmouth, MA 02747 and is currently estimated at $479,643, approximately $401 per square foot. 17 Sable Ave is a home located in Bristol County with nearby schools including Dartmouth High School, Friends Academy, and Our Sister's School.
Ownership History
Date
Name
Owned For
Owner Type
Purchase Details
Closed on
Jun 4, 2021
Sold by
Medeiros Manuel P and Medeiros Catherine
Bought by
Medeiros Irt
Current Estimated Value
Purchase Details
Closed on
Dec 3, 2004
Sold by
Mello Wayne and Zannini Marilyn
Bought by
Medeiros Manuel P and Medeiros Catherine
Home Financials for this Owner
Home Financials are based on the most recent Mortgage that was taken out on this home.
Original Mortgage
$168,000
Interest Rate
5.69%
Mortgage Type
Purchase Money Mortgage
Create a Home Valuation Report for This Property
The Home Valuation Report is an in-depth analysis detailing your home's value as well as a comparison with similar homes in the area
Home Values in the Area
Average Home Value in this Area
Purchase History
| Date | Buyer | Sale Price | Title Company |
|---|---|---|---|
| Medeiros Irt | -- | None Available | |
| Medeiros Manuel P | $280,000 | -- |
Source: Public Records
Mortgage History
| Date | Status | Borrower | Loan Amount |
|---|---|---|---|
| Previous Owner | Medeiros Manuel P | $168,000 |
Source: Public Records
Tax History Compared to Growth
Tax History
| Year | Tax Paid | Tax Assessment Tax Assessment Total Assessment is a certain percentage of the fair market value that is determined by local assessors to be the total taxable value of land and additions on the property. | Land | Improvement |
|---|---|---|---|---|
| 2025 | $3,390 | $374,600 | $158,600 | $216,000 |
| 2024 | $3,266 | $357,300 | $151,300 | $206,000 |
| 2023 | $3,162 | $326,300 | $140,300 | $186,000 |
| 2022 | $2,994 | $289,000 | $134,200 | $154,800 |
| 2021 | $2,927 | $270,300 | $118,400 | $151,900 |
| 2020 | $2,867 | $263,500 | $118,400 | $145,100 |
| 2019 | $2,838 | $261,600 | $118,400 | $143,200 |
| 2018 | $2,709 | $245,100 | $118,400 | $126,700 |
| 2017 | $2,512 | $236,100 | $111,700 | $124,400 |
| 2016 | $2,415 | $228,300 | $111,700 | $116,600 |
| 2015 | $2,338 | $222,500 | $104,400 | $118,100 |
| 2014 | $2,194 | $210,200 | $94,700 | $115,500 |
Source: Public Records
Map
Nearby Homes
- 1004 Allen St
- 6 Strathmore Rd
- 0 Victoria St Unit 73457953
- 25 Westwood Dr
- 50 Gaywood St
- 29 Elizabeth Ct
- 24 Wayne Memorial Dr
- 59 Longwood Ave
- 729 Allen St
- 6 Walters Way
- 295 Commonwealth Ave
- 317 Commonwealth Ave
- 0 Norfolk Ave Unit 73403282
- 33 Rosewood Terrace
- 0 Middlesex St
- 511 Bedford St
- 35 Suffolk Ave
- 35 Jenny Lind St
- 330 Maple St
- 98 Mccabe St