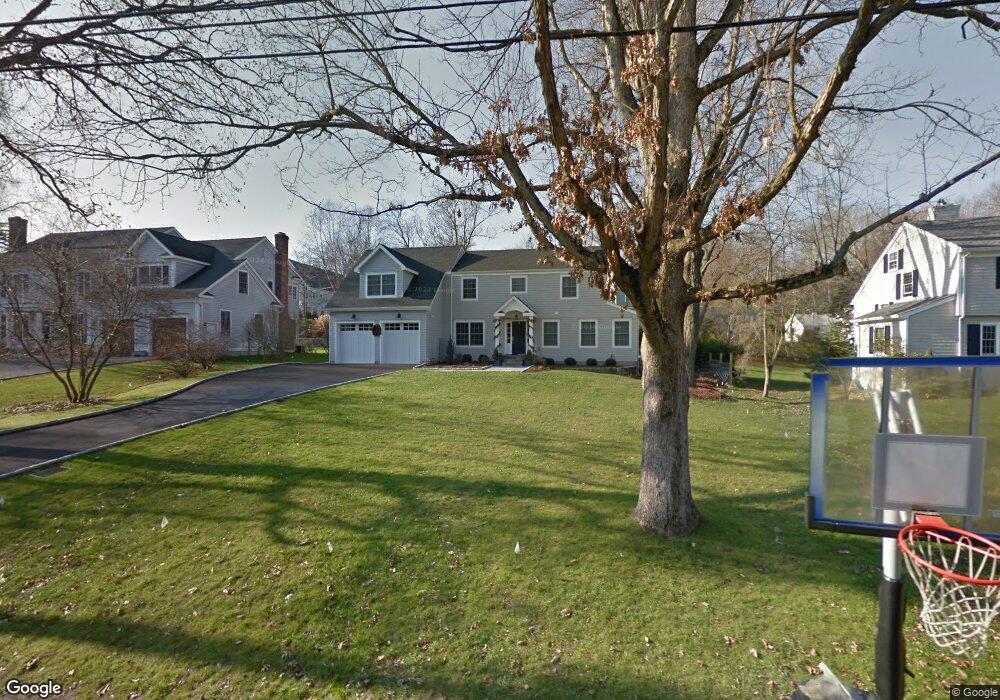
17 Salt Box Ln Darien, CT 06820
Estimated Value: $2,686,170 - $2,774,000
5
Beds
6
Baths
4,106
Sq Ft
$662/Sq Ft
Est. Value
About This Home
This home is located at 17 Salt Box Ln, Darien, CT 06820 and is currently estimated at $2,717,793, approximately $661 per square foot. 17 Salt Box Ln is a home located in Fairfield County with nearby schools including Hindley Elementary School, Middlesex Middle School, and Darien High School.
Ownership History
Date
Name
Owned For
Owner Type
Purchase Details
Closed on
Jul 2, 2013
Sold by
Pearson Julia C
Bought by
Lyons Edward D and Lyons Colleen K
Current Estimated Value
Home Financials for this Owner
Home Financials are based on the most recent Mortgage that was taken out on this home.
Original Mortgage
$875,000
Outstanding Balance
$625,084
Interest Rate
3.51%
Estimated Equity
$2,092,709
Purchase Details
Closed on
May 15, 1992
Sold by
Compernolle Thomas and Compernolle Mary
Bought by
Pearson Gary and Pearson Julia
Purchase Details
Closed on
Aug 16, 1989
Sold by
Arthur Henry
Bought by
Campernolle Thomas
Create a Home Valuation Report for This Property
The Home Valuation Report is an in-depth analysis detailing your home's value as well as a comparison with similar homes in the area
Home Values in the Area
Average Home Value in this Area
Purchase History
| Date | Buyer | Sale Price | Title Company |
|---|---|---|---|
| Lyons Edward D | $1,250,000 | -- | |
| Pearson Gary | $427,500 | -- | |
| Campernolle Thomas | $413,528 | -- |
Source: Public Records
Mortgage History
| Date | Status | Borrower | Loan Amount |
|---|---|---|---|
| Open | Campernolle Thomas | $875,000 | |
| Previous Owner | Campernolle Thomas | $470,000 |
Source: Public Records
Tax History Compared to Growth
Tax History
| Year | Tax Paid | Tax Assessment Tax Assessment Total Assessment is a certain percentage of the fair market value that is determined by local assessors to be the total taxable value of land and additions on the property. | Land | Improvement |
|---|---|---|---|---|
| 2025 | $19,586 | $1,265,250 | $593,880 | $671,370 |
| 2024 | $18,587 | $1,265,250 | $593,880 | $671,370 |
| 2023 | $16,327 | $927,150 | $424,200 | $502,950 |
| 2022 | $15,975 | $927,150 | $424,200 | $502,950 |
| 2021 | $15,613 | $927,150 | $424,200 | $502,950 |
| 2020 | $15,168 | $927,150 | $424,200 | $502,950 |
| 2019 | $15,270 | $927,150 | $424,200 | $502,950 |
| 2018 | $4,867 | $1,145,060 | $523,810 | $621,250 |
| 2017 | $18,504 | $1,145,060 | $523,810 | $621,250 |
| 2016 | $18,058 | $1,145,060 | $523,810 | $621,250 |
| 2015 | $17,479 | $1,138,690 | $523,810 | $614,880 |
| 2014 | $11,796 | $785,890 | $523,810 | $262,080 |
Source: Public Records
Map
Nearby Homes
- 47 Hollow Tree Ridge Rd
- 53 Noroton Ave
- 77 Maple St
- 19 Anthony Ln
- 166 Hollow Tree Ridge Rd
- 105 Houston Terrace
- 16 Houston Terrace Unit 7
- 333 West Ave Unit 3
- 120 Webb Ave
- 19 William St
- 39 Noroton Ave
- 90 Courtland Hill St
- 28 Aquila Rd
- 16 Neponsit St
- 203 Sylvan Knoll Rd
- 171 Sylvan Knoll Rd
- 214 Seaside Ave
- 214 Seaside Ave Unit 2
- 59 Courtland Ave Unit 3O
- 59 Courtland Ave Unit 2T