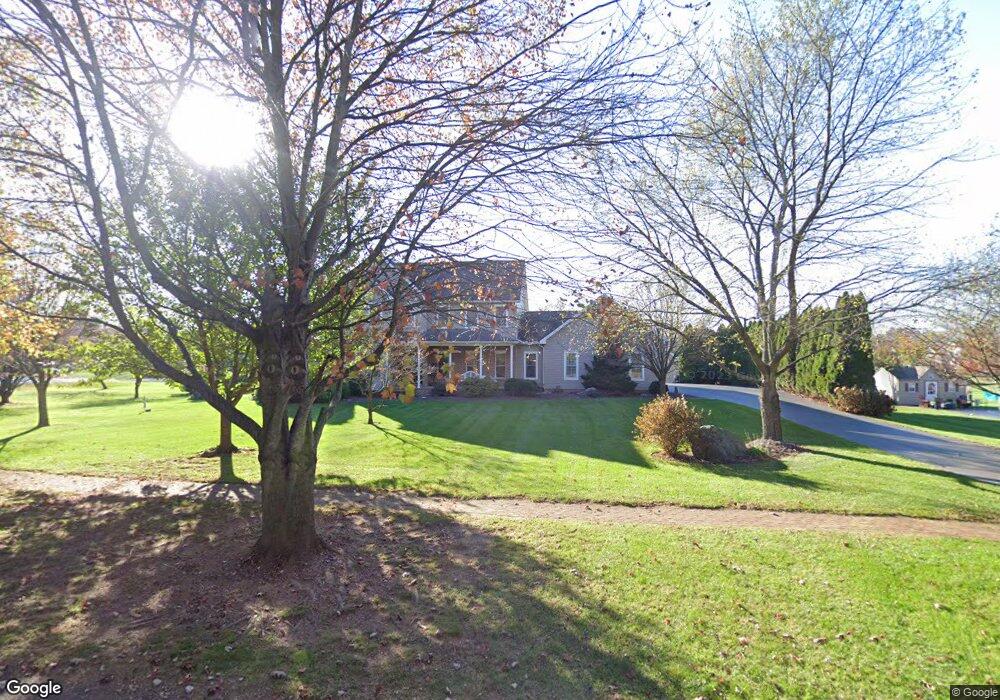
17 Sandy Bottom Rd Carlisle, PA 17015
Estimated Value: $631,279 - $712,000
4
Beds
4
Baths
3,328
Sq Ft
$206/Sq Ft
Est. Value
About This Home
This home is located at 17 Sandy Bottom Rd, Carlisle, PA 17015 and is currently estimated at $686,070, approximately $206 per square foot. 17 Sandy Bottom Rd is a home located in Cumberland County with nearby schools including North Dickinson Elementary School, Lamberton Middle School, and Carlisle Area High School.
Ownership History
Date
Name
Owned For
Owner Type
Purchase Details
Closed on
Oct 15, 2003
Sold by
Zoeller Scott
Bought by
Lentz Alan E
Current Estimated Value
Home Financials for this Owner
Home Financials are based on the most recent Mortgage that was taken out on this home.
Original Mortgage
$248,000
Outstanding Balance
$117,475
Interest Rate
6.43%
Mortgage Type
New Conventional
Estimated Equity
$568,595
Purchase Details
Closed on
Nov 21, 2000
Sold by
Diehl Wilber L
Bought by
Yanek Custom Homes Inc
Create a Home Valuation Report for This Property
The Home Valuation Report is an in-depth analysis detailing your home's value as well as a comparison with similar homes in the area
Home Values in the Area
Average Home Value in this Area
Purchase History
| Date | Buyer | Sale Price | Title Company |
|---|---|---|---|
| Lentz Alan E | $383,000 | -- | |
| Yanek Custom Homes Inc | $44,000 | -- |
Source: Public Records
Mortgage History
| Date | Status | Borrower | Loan Amount |
|---|---|---|---|
| Open | Lentz Alan E | $248,000 |
Source: Public Records
Tax History Compared to Growth
Tax History
| Year | Tax Paid | Tax Assessment Tax Assessment Total Assessment is a certain percentage of the fair market value that is determined by local assessors to be the total taxable value of land and additions on the property. | Land | Improvement |
|---|---|---|---|---|
| 2025 | $8,766 | $422,700 | $85,500 | $337,200 |
| 2024 | $8,480 | $422,700 | $85,500 | $337,200 |
| 2023 | $8,172 | $422,700 | $85,500 | $337,200 |
| 2022 | $7,723 | $422,700 | $85,500 | $337,200 |
| 2021 | $7,593 | $422,700 | $85,500 | $337,200 |
| 2020 | $7,404 | $422,700 | $85,500 | $337,200 |
| 2019 | $7,221 | $422,700 | $85,500 | $337,200 |
| 2018 | $7,037 | $422,700 | $85,500 | $337,200 |
| 2017 | $6,870 | $422,700 | $85,500 | $337,200 |
| 2016 | -- | $422,700 | $85,500 | $337,200 |
| 2015 | -- | $422,700 | $85,500 | $337,200 |
| 2014 | -- | $422,700 | $85,500 | $337,200 |
Source: Public Records
Map
Nearby Homes