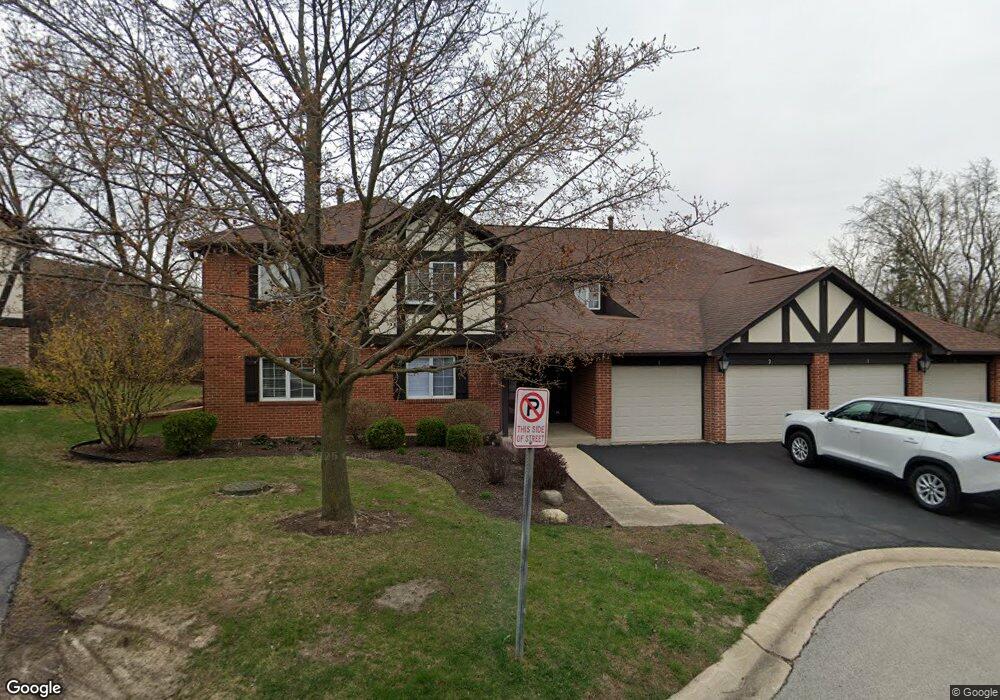
17 Sauk Trail Unit 1 Indian Head Park, IL 60525
Estimated Value: $111,177 - $324,000
3
Beds
2
Baths
180,000
Sq Ft
$1/Sq Ft
Est. Value
About This Home
This home is located at 17 Sauk Trail Unit 1, Indian Head Park, IL 60525 and is currently estimated at $258,044, approximately $1 per square foot. 17 Sauk Trail Unit 1 is a home located in Cook County with nearby schools including Highlands Elementary School, Highlands Middle School, and Lyons Township High School.
Ownership History
Date
Name
Owned For
Owner Type
Purchase Details
Closed on
Apr 11, 2013
Sold by
Lucente Barbara J
Bought by
State Bank Of Countryside and Trust Number 09 3104
Current Estimated Value
Purchase Details
Closed on
Jan 29, 2013
Sold by
State Bank Of Countryside
Bought by
Lucente Barbara J
Home Financials for this Owner
Home Financials are based on the most recent Mortgage that was taken out on this home.
Original Mortgage
$100,000
Interest Rate
3.52%
Mortgage Type
New Conventional
Purchase Details
Closed on
Jul 16, 2009
Sold by
Lucente Barbara J
Bought by
State Bank Of Countryside and Trust #09-3104
Purchase Details
Closed on
Mar 13, 2008
Sold by
Vanbeveren Therese
Bought by
Lucente Barbara J
Home Financials for this Owner
Home Financials are based on the most recent Mortgage that was taken out on this home.
Original Mortgage
$185,000
Interest Rate
5.74%
Mortgage Type
Unknown
Create a Home Valuation Report for This Property
The Home Valuation Report is an in-depth analysis detailing your home's value as well as a comparison with similar homes in the area
Home Values in the Area
Average Home Value in this Area
Purchase History
| Date | Buyer | Sale Price | Title Company |
|---|---|---|---|
| State Bank Of Countryside | -- | None Available | |
| Lucente Barbara J | -- | Liberty Title & Escrow Compa | |
| State Bank Of Countryside | -- | None Available | |
| Lucente Barbara J | $235,000 | Cti |
Source: Public Records
Mortgage History
| Date | Status | Borrower | Loan Amount |
|---|---|---|---|
| Previous Owner | Lucente Barbara J | $100,000 | |
| Previous Owner | Lucente Barbara J | $185,000 |
Source: Public Records
Tax History Compared to Growth
Tax History
| Year | Tax Paid | Tax Assessment Tax Assessment Total Assessment is a certain percentage of the fair market value that is determined by local assessors to be the total taxable value of land and additions on the property. | Land | Improvement |
|---|---|---|---|---|
| 2024 | $842 | $3,754 | $813 | $2,941 |
| 2023 | $811 | $3,754 | $813 | $2,941 |
| 2022 | $811 | $3,044 | $504 | $2,540 |
| 2021 | $769 | $3,043 | $503 | $2,540 |
| 2020 | $752 | $3,043 | $503 | $2,540 |
| 2019 | $698 | $2,818 | $455 | $2,363 |
| 2018 | $685 | $2,818 | $455 | $2,363 |
| 2017 | $665 | $2,818 | $455 | $2,363 |
| 2016 | $594 | $2,273 | $390 | $1,883 |
| 2015 | $585 | $2,273 | $390 | $1,883 |
| 2014 | $577 | $2,273 | $390 | $1,883 |
| 2013 | $698 | $2,891 | $390 | $2,501 |
Source: Public Records
Map
Nearby Homes
- 111 Acacia Dr Unit 508
- 127 Acacia Cir Unit 505
- 6810 Joliet Rd Unit 5
- 6818 Joliet Rd Unit 9
- 6441 Blackhawk Trail
- 164 Cascade Dr
- 170 Cascade Dr
- 191 Cascade Dr
- 7445 Willow Springs Rd
- 6262 Edgebrook Ln E
- 11407 Hiawatha Ln
- 10725 Forestview Rd
- 11300 Sequoya Ln
- 1140 64th St Unit 6
- 6001 Wolf Rd
- 1901 W Plainfield Rd
- 6630 S Brainard Ave Unit PT203
- 7001 Sunset Ave
- 904 Hickory Dr
- 6670 S Brainard Ave Unit 402
- 17 Sauk Trail Unit 1
- 17 Sauk Trail Unit 2
- 17 Sauk Trail Unit 3
- 17 Sauk Trail Unit 4
- 17 Sauk Trail Unit 4
- 17 Sauk Trail Unit 2
- 17 Sauk Trail Unit 3
- 17 Saulk Trail Unit 2
- 15 Sauk Trail Unit 2
- 15 Sauk Trail Unit 3
- 15 Sauk Trail Unit 4
- 15 Sauk Trail Unit 3
- 15 Sauk Trail Unit 2
- 15 Sauk Trail Unit 1
- 15 Sauk Trail Unit 1
- 15 Sauk Trail Unit 4
- 18 Sauk Trail Unit 4
- 18 Sauk Trail Unit 3
- 18 Sauk Trail Unit 2
- 6820 Joliet Rd Unit 4