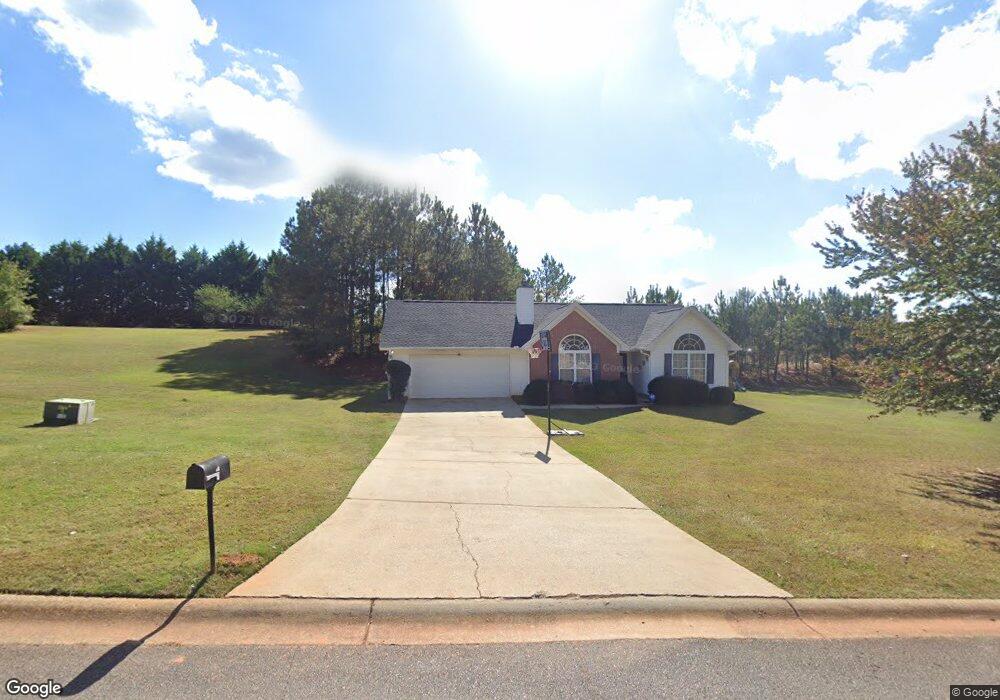
17 Savannah Place Dr Lagrange, GA 30240
Estimated Value: $220,000 - $253,000
3
Beds
2
Baths
1,386
Sq Ft
$170/Sq Ft
Est. Value
About This Home
This home is located at 17 Savannah Place Dr, Lagrange, GA 30240 and is currently estimated at $235,795, approximately $170 per square foot. 17 Savannah Place Dr is a home located in Troup County with nearby schools including Long Cane Elementary School, Berta Weathersbee Elementary School, and Whitesville Road Elementary School.
Ownership History
Date
Name
Owned For
Owner Type
Purchase Details
Closed on
Mar 13, 2008
Sold by
Godfrey Lawanda J
Bought by
Aspinwall James R
Current Estimated Value
Purchase Details
Closed on
Mar 3, 2008
Sold by
General Warranty Svcs Inc
Bought by
Ballard Gerald B
Purchase Details
Closed on
Oct 21, 2006
Sold by
Gilliam Lawanda Jean
Bought by
Godfrey Lawanda J
Home Financials for this Owner
Home Financials are based on the most recent Mortgage that was taken out on this home.
Original Mortgage
$126,000
Interest Rate
6.31%
Mortgage Type
New Conventional
Purchase Details
Closed on
May 11, 2004
Sold by
Jerry Ballard Homes Inc
Bought by
Lawanda Lawanda J and Lawanda Raymundo
Purchase Details
Closed on
Jun 25, 2003
Sold by
Gerald B Ballard
Bought by
Jerry Ballard Homes Inc
Purchase Details
Closed on
Apr 23, 2001
Bought by
Gerald B Ballard
Create a Home Valuation Report for This Property
The Home Valuation Report is an in-depth analysis detailing your home's value as well as a comparison with similar homes in the area
Home Values in the Area
Average Home Value in this Area
Purchase History
| Date | Buyer | Sale Price | Title Company |
|---|---|---|---|
| Aspinwall James R | $102,000 | -- | |
| Ballard Gerald B | -- | -- | |
| Godfrey Lawanda J | -- | -- | |
| Godfrey Lawanda J | -- | -- | |
| Lawanda Lawanda J | $119,800 | -- | |
| Jerry Ballard Homes Inc | -- | -- | |
| Gerald B Ballard | -- | -- |
Source: Public Records
Mortgage History
| Date | Status | Borrower | Loan Amount |
|---|---|---|---|
| Previous Owner | Godfrey Lawanda J | $126,000 |
Source: Public Records
Tax History Compared to Growth
Tax History
| Year | Tax Paid | Tax Assessment Tax Assessment Total Assessment is a certain percentage of the fair market value that is determined by local assessors to be the total taxable value of land and additions on the property. | Land | Improvement |
|---|---|---|---|---|
| 2024 | $1,394 | $64,760 | $14,000 | $50,760 |
| 2023 | $1,705 | $62,520 | $10,000 | $52,520 |
| 2022 | $1,483 | $53,120 | $8,000 | $45,120 |
| 2021 | $1,530 | $50,720 | $8,000 | $42,720 |
| 2020 | $1,530 | $50,720 | $8,000 | $42,720 |
| 2019 | $1,468 | $48,680 | $6,000 | $42,680 |
| 2018 | $1,351 | $44,800 | $6,000 | $38,800 |
| 2017 | $1,351 | $44,800 | $6,000 | $38,800 |
| 2016 | $1,282 | $42,510 | $4,860 | $37,650 |
| 2015 | $1,284 | $42,510 | $4,860 | $37,650 |
| 2014 | $1,226 | $40,528 | $4,860 | $35,668 |
| 2013 | -- | $42,745 | $4,860 | $37,885 |
Source: Public Records
Map
Nearby Homes
- 119 Plymouth Dr
- 141 Plymouth Dr
- 102 Franklin Place
- 101 Ivy Springs Dr
- 474 Newton Rd
- 40 River Point Dr
- 100 Huntcliff Ct
- 135 Planters Ridge Dr
- 124 Foxdale Dr
- 110 Hawthorne Cir
- 105 Hawthorne Cir
- 103 Hawthorne Cir
- 190 Hill Rd
- 0 Deming St Unit 10550189
- 205 Linda Ln
- 108 Hidden Springs Dr
- 709 Vernon Ferry Rd
- 1565 Glass Bridge Rd
- 103 Dogwood Ct
- 226 Linda Ln
- 3 Carnegie Ct
- 0 Carnegie Ct Unit 7518306
- 0 Carnegie Ct Unit 7274750
- 0 Savannah Place Dr Unit 7311001
- 0 Savannah Place Dr Unit 7222378
- 0 Savannah Place Dr Unit 7201008
- 0 Savannah Place Dr Unit 7035705
- 0 Savannah Place Dr Unit 7020789
- 0 Savannah Place Dr Unit 7340180
- 0 Savannah Place Dr Unit 7236249
- 0 Savannah Place Dr Unit 3194433
- 0 Savannah Place Dr Unit 8707156
- 0 Savannah Place Dr Unit 8517216
- 0 Savannah Place Dr Unit 8200438
- 0 Savannah Place Dr Unit 8137504
- 0 Savannah Place Dr Unit 8099422
- 0 Savannah Place Dr Unit 7584577
- 0 Savannah Place Dr Unit 8790088
- 0 Savannah Place Dr Unit 7450143
- 0 Savannah Place Dr Unit 7259408