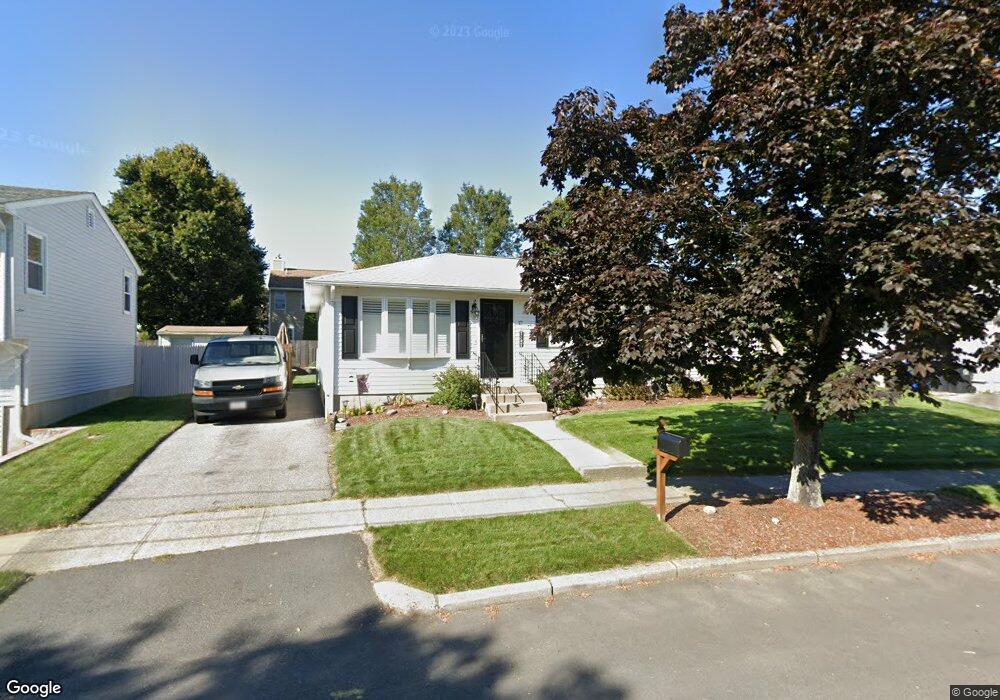
17 Scott Dr Riverside, RI 02915
Riverside NeighborhoodEstimated Value: $455,479 - $514,000
3
Beds
2
Baths
1,576
Sq Ft
$307/Sq Ft
Est. Value
About This Home
This home is located at 17 Scott Dr, Riverside, RI 02915 and is currently estimated at $484,370, approximately $307 per square foot. 17 Scott Dr is a home located in Providence County with nearby schools including East Providence High School, St Luke Elementary School, and St Mary Academy-Bay View.
Ownership History
Date
Name
Owned For
Owner Type
Purchase Details
Closed on
May 21, 2024
Sold by
Mayer Robert T and Mayer Diane M
Bought by
Mayer 143 Intervivos T
Current Estimated Value
Purchase Details
Closed on
Nov 15, 1993
Sold by
Raposa Aires C and Raposa Maria
Bought by
Mayer Robert T and Mayer Diane
Create a Home Valuation Report for This Property
The Home Valuation Report is an in-depth analysis detailing your home's value as well as a comparison with similar homes in the area
Home Values in the Area
Average Home Value in this Area
Purchase History
| Date | Buyer | Sale Price | Title Company |
|---|---|---|---|
| Mayer 143 Intervivos T | -- | None Available | |
| Mayer 143 Intervivos T | -- | None Available | |
| Mayer Robert T | $113,000 | -- | |
| Mayer Robert T | $113,000 | -- |
Source: Public Records
Mortgage History
| Date | Status | Borrower | Loan Amount |
|---|---|---|---|
| Previous Owner | Mayer Robert T | $187,000 | |
| Previous Owner | Mayer Robert T | $184,500 | |
| Previous Owner | Mayer Robert T | $153,000 |
Source: Public Records
Tax History
| Year | Tax Paid | Tax Assessment Tax Assessment Total Assessment is a certain percentage of the fair market value that is determined by local assessors to be the total taxable value of land and additions on the property. | Land | Improvement |
|---|---|---|---|---|
| 2025 | $5,603 | $428,700 | $128,300 | $300,400 |
| 2024 | $5,456 | $355,900 | $106,900 | $249,000 |
| 2023 | $5,253 | $355,900 | $106,900 | $249,000 |
| 2022 | $4,991 | $228,300 | $54,500 | $173,800 |
| 2021 | $4,908 | $228,300 | $54,500 | $173,800 |
| 2020 | $4,701 | $228,300 | $54,500 | $173,800 |
| 2019 | $4,571 | $228,300 | $54,500 | $173,800 |
| 2018 | $4,569 | $199,700 | $53,000 | $146,700 |
| 2017 | $4,467 | $199,700 | $53,000 | $146,700 |
| 2016 | $4,445 | $199,700 | $53,000 | $146,700 |
| 2015 | $4,202 | $183,100 | $49,100 | $134,000 |
| 2014 | $4,202 | $183,100 | $49,100 | $134,000 |
Source: Public Records
Map
Nearby Homes
- 14 Winthrop St
- 14 Benedict St
- 25 Winslow St
- 15 Claire St
- 85 Hilton Ave
- 10 Booth Ave
- 15 Plaza Dr
- 103 Burnside Ave
- 23 Albert Ave
- 41 White Ave
- 72 Stowe Ave
- 25 Arnold St
- 33 Pine St Unit 35
- 0 Carousel Dr
- 151 Willett Ave Unit 2
- 28 Jefferson Ave
- 45 Washington Rd
- 129 Shore Rd
- 6 Hazelton Rd
- 916 Bullocks Pt Ave
Your Personal Tour Guide
Ask me questions while you tour the home.