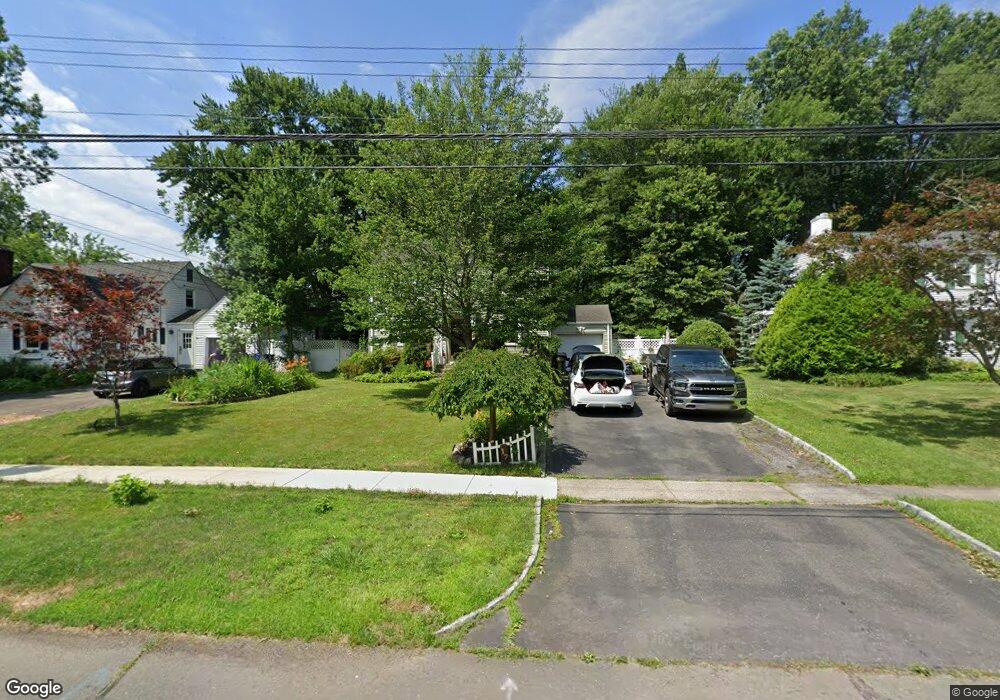
17 Seneca Rd West Hartford, CT 06117
Estimated Value: $457,000 - $499,000
3
Beds
2
Baths
1,604
Sq Ft
$298/Sq Ft
Est. Value
About This Home
This home is located at 17 Seneca Rd, West Hartford, CT 06117 and is currently estimated at $477,226, approximately $297 per square foot. 17 Seneca Rd is a home located in Hartford County with nearby schools including Aiken School, King Philip Middle School, and Delta High School.
Ownership History
Date
Name
Owned For
Owner Type
Purchase Details
Closed on
Apr 12, 2010
Sold by
Wilkins-Smith Ana P
Bought by
Wilkins-Smith Ana P and Smith Byron C
Current Estimated Value
Purchase Details
Closed on
Dec 23, 2002
Sold by
Ksub Assoc Llc
Bought by
Lebowitz Albert and Lebowitz Mildred
Home Financials for this Owner
Home Financials are based on the most recent Mortgage that was taken out on this home.
Original Mortgage
$160,000
Interest Rate
6.16%
Create a Home Valuation Report for This Property
The Home Valuation Report is an in-depth analysis detailing your home's value as well as a comparison with similar homes in the area
Home Values in the Area
Average Home Value in this Area
Purchase History
| Date | Buyer | Sale Price | Title Company |
|---|---|---|---|
| Wilkins-Smith Ana P | -- | -- | |
| Lebowitz Albert | $254,360 | -- | |
| Wilkins Ana P | $203,000 | -- |
Source: Public Records
Mortgage History
| Date | Status | Borrower | Loan Amount |
|---|---|---|---|
| Closed | Wilkins Ana P | $208,000 | |
| Previous Owner | Wilkins Ana P | $160,000 |
Source: Public Records
Tax History Compared to Growth
Tax History
| Year | Tax Paid | Tax Assessment Tax Assessment Total Assessment is a certain percentage of the fair market value that is determined by local assessors to be the total taxable value of land and additions on the property. | Land | Improvement |
|---|---|---|---|---|
| 2025 | $8,971 | $200,340 | $76,580 | $123,760 |
| 2024 | $8,484 | $200,340 | $76,580 | $123,760 |
| 2023 | $8,198 | $200,340 | $76,580 | $123,760 |
| 2022 | $8,150 | $200,340 | $76,580 | $123,760 |
| 2021 | $7,973 | $187,950 | $68,950 | $119,000 |
| 2020 | $7,195 | $172,130 | $61,530 | $110,600 |
| 2019 | $7,195 | $172,130 | $61,530 | $110,600 |
| 2018 | $7,057 | $172,130 | $61,530 | $110,600 |
| 2017 | $7,064 | $172,130 | $61,530 | $110,600 |
| 2016 | $6,436 | $162,890 | $55,650 | $107,240 |
| 2015 | $6,240 | $162,890 | $55,650 | $107,240 |
| 2014 | $6,087 | $162,890 | $55,650 | $107,240 |
Source: Public Records
Map
Nearby Homes
- 3 Pilgrim Rd
- 11 Lawler Rd
- 139 Mohawk Dr
- 320 N Steele Rd
- 1993 Albany Ave
- 3 Trumbull Ln
- 5 Adams Ln
- 129 Middlebrook Rd
- 148 King Philip Dr
- 1272 Trout Brook Dr
- 5 Northmoor Rd
- 62 Blue Ridge Ln
- 30 Farmstead Ln
- 111 Bloomfield Ave
- 2581 Albany Ave
- 9 Timberwood Rd
- 47 Flagg Rd
- 165 Bloomfield Ave
- 15 Sunny Reach Dr
- 50 Magnolia Hill