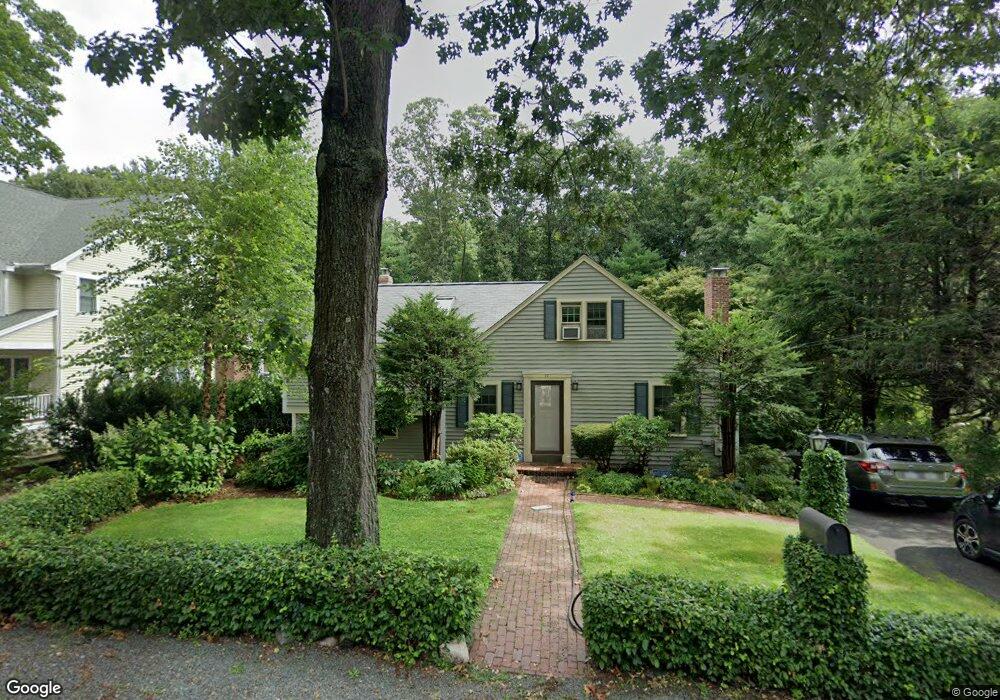
17 Shade St Lexington, MA 02421
Idylwilde NeighborhoodEstimated Value: $1,350,000 - $1,659,000
3
Beds
2
Baths
2,150
Sq Ft
$665/Sq Ft
Est. Value
About This Home
This home is located at 17 Shade St, Lexington, MA 02421 and is currently estimated at $1,430,110, approximately $665 per square foot. 17 Shade St is a home located in Middlesex County with nearby schools including Bridge Elementary School, Jonas Clarke Middle School, and Lexington High School.
Ownership History
Date
Name
Owned For
Owner Type
Purchase Details
Closed on
Oct 17, 2024
Sold by
Chisom Linda G and Ferullo Michael J
Bought by
Linda G Chisom T G and Linda Chisom
Current Estimated Value
Purchase Details
Closed on
Aug 17, 2009
Sold by
Moulin Daniel and Osborne Adelaide N
Bought by
Chisom Linda G and Ferullo Michael J
Home Financials for this Owner
Home Financials are based on the most recent Mortgage that was taken out on this home.
Original Mortgage
$130,000
Interest Rate
5.36%
Mortgage Type
Purchase Money Mortgage
Purchase Details
Closed on
Mar 7, 2007
Sold by
Osborne Adelaide N
Bought by
Osborne Adelaide N and Moulin Daniel
Purchase Details
Closed on
Jan 21, 2005
Sold by
Osborne Adelaide N and Moulin Daniel
Bought by
Osborne Adelaide N
Create a Home Valuation Report for This Property
The Home Valuation Report is an in-depth analysis detailing your home's value as well as a comparison with similar homes in the area
Home Values in the Area
Average Home Value in this Area
Purchase History
| Date | Buyer | Sale Price | Title Company |
|---|---|---|---|
| Linda G Chisom T G | -- | None Available | |
| Linda G Chisom T G | -- | None Available | |
| Chisom Linda G | $611,000 | -- | |
| Osborne Adelaide N | -- | -- | |
| Osborne Adelaide N | -- | -- | |
| Chisom Linda G | $611,000 | -- | |
| Osborne Adelaide N | -- | -- | |
| Osborne Adelaide N | -- | -- |
Source: Public Records
Mortgage History
| Date | Status | Borrower | Loan Amount |
|---|---|---|---|
| Previous Owner | Osborne Adelaide N | $127,400 | |
| Previous Owner | Chisom Linda G | $130,000 |
Source: Public Records
Tax History Compared to Growth
Tax History
| Year | Tax Paid | Tax Assessment Tax Assessment Total Assessment is a certain percentage of the fair market value that is determined by local assessors to be the total taxable value of land and additions on the property. | Land | Improvement |
|---|---|---|---|---|
| 2025 | $13,575 | $1,110,000 | $670,000 | $440,000 |
| 2024 | $13,181 | $1,076,000 | $638,000 | $438,000 |
| 2023 | $12,532 | $964,000 | $580,000 | $384,000 |
| 2022 | $12,185 | $883,000 | $527,000 | $356,000 |
| 2021 | $7 | $843,000 | $502,000 | $341,000 |
| 2020 | $11,985 | $853,000 | $502,000 | $351,000 |
| 2019 | $11,522 | $816,000 | $478,000 | $338,000 |
| 2018 | $5,146 | $787,000 | $455,000 | $332,000 |
| 2017 | $10,766 | $743,000 | $420,000 | $323,000 |
| 2016 | $10,322 | $707,000 | $400,000 | $307,000 |
| 2015 | $10,031 | $675,000 | $364,000 | $311,000 |
| 2014 | $8,391 | $541,000 | $323,000 | $218,000 |
Source: Public Records
Map
Nearby Homes
- 9 Journeys End Ln
- 9 Journeys End Ln Unit 9
- 8 Marlboro Rd
- 468 Marrett Rd
- 127 Shade St
- 46 Middle St
- 10 Idylwilde Rd
- 14 Benjamin Rd
- 70 Valleyfield St
- 383 Marrett Rd
- 17 Prospect Hill Rd
- 370 Lincoln St
- 21 Valleyfield St
- 2 Effie Place
- 464 Concord Ave
- 5 Leroy Rd
- 20 Loring Rd
- 671 Marrett Rd
- 22 Common Ct
- 143 Lincoln St