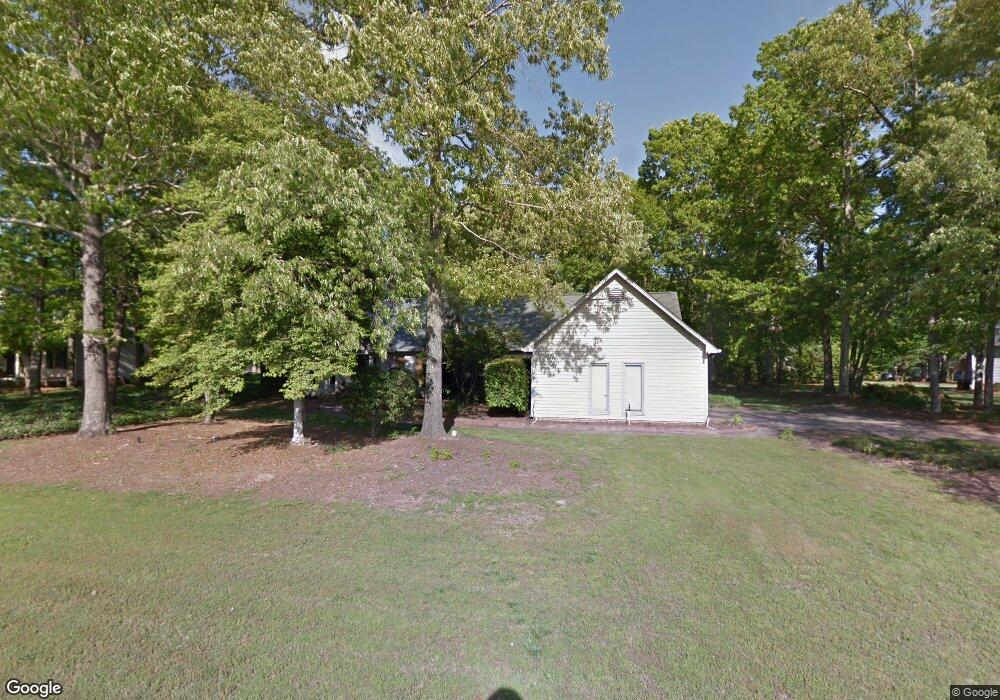
17 Shadow Mist Dr Simpsonville, SC 29681
Estimated Value: $477,842 - $564,000
3
Beds
3
Baths
2,972
Sq Ft
$175/Sq Ft
Est. Value
About This Home
This home is located at 17 Shadow Mist Dr, Simpsonville, SC 29681 and is currently estimated at $520,461, approximately $175 per square foot. 17 Shadow Mist Dr is a home located in Greenville County with nearby schools including Bethel Elementary School, Hillcrest Middle School, and Hillcrest High School.
Ownership History
Date
Name
Owned For
Owner Type
Purchase Details
Closed on
Jun 16, 2009
Sold by
Primacy Closing Corporation
Bought by
Thompson Kevin Michael
Current Estimated Value
Home Financials for this Owner
Home Financials are based on the most recent Mortgage that was taken out on this home.
Original Mortgage
$229,761
Outstanding Balance
$142,812
Interest Rate
4.79%
Mortgage Type
FHA
Estimated Equity
$377,649
Purchase Details
Closed on
Jun 9, 2008
Sold by
Persico Daniel F and Persico Misty
Bought by
Primacy Closing Corporation
Purchase Details
Closed on
Dec 7, 2006
Sold by
Eisenbise Michael J and Eisenbise Denise G
Bought by
Persico Daniel F and Persico Misty
Home Financials for this Owner
Home Financials are based on the most recent Mortgage that was taken out on this home.
Original Mortgage
$216,000
Interest Rate
6.07%
Mortgage Type
Purchase Money Mortgage
Purchase Details
Closed on
May 3, 1999
Sold by
Phillips J W
Bought by
Eisenbise Michael J
Create a Home Valuation Report for This Property
The Home Valuation Report is an in-depth analysis detailing your home's value as well as a comparison with similar homes in the area
Home Values in the Area
Average Home Value in this Area
Purchase History
We collect this data history from publicly available records. To have your information removed, we recommend requesting removal directly through your county’s website.
| Date | Buyer | Sale Price | Title Company |
|---|---|---|---|
| Thompson Kevin Michael | $234,000 | -- | |
| Primacy Closing Corporation | $263,000 | -- | |
| Persico Daniel F | $270,000 | None Available | |
| Eisenbise Michael J | $203,000 | -- |
Source: Public Records
Mortgage History
We collect this data history from publicly available records. To have your information removed, we recommend requesting removal directly through your county’s website.
| Date | Status | Borrower | Loan Amount |
|---|---|---|---|
| Open | Thompson Kevin Michael | $229,761 | |
| Previous Owner | Persico Daniel F | $216,000 |
Source: Public Records
Tax History
| Year | Tax Paid | Tax Assessment Tax Assessment Total Assessment is a certain percentage of the fair market value that is determined by local assessors to be the total taxable value of land and additions on the property. | Land | Improvement |
|---|---|---|---|---|
| 2025 | $1,972 | $13,870 | $3,520 | $10,350 |
| 2024 | $1,972 | $12,060 | $2,300 | $9,760 |
| 2023 | $1,897 | $12,060 | $2,300 | $9,760 |
| 2022 | $1,849 | $12,060 | $2,300 | $9,760 |
| 2021 | $1,850 | $12,060 | $2,300 | $9,760 |
| 2020 | $1,691 | $10,490 | $2,000 | $8,490 |
| 2019 | $1,692 | $10,490 | $2,000 | $8,490 |
| 2018 | $1,691 | $10,490 | $2,000 | $8,490 |
| 2017 | $1,693 | $10,490 | $2,000 | $8,490 |
| 2016 | $1,632 | $262,220 | $50,000 | $212,220 |
| 2015 | $1,635 | $262,220 | $50,000 | $212,220 |
| 2014 | $1,488 | $251,170 | $50,000 | $201,170 |
Source: Public Records
Map
Nearby Homes
- 175 Duffie Rd
- 601 Kingsmoor Dr
- 102 Harts Ln
- 630 S Carolina 14
- 5 Springleaf Ct
- 305 Saybrook Rd
- 1408 S Carolina 14
- 104 Shadowcreek Ct
- 212 Timber Fence Trail
- 825 Brielle Ct
- 2 Tearose Ln
- 23 Slow Creek Dr
- 8 Lone Oak Ave
- 208 Holland Rd
- 832 Brielle Ct
- 810 Appleby Dr
- 204 Candleston Place
- 907 Highway 14
- 268 Applehill Way
- 313 Sedgebrook Dr
- 19 Shadow Mist Dr
- 15 Shadow Mist Dr
- 318 Shadow Ridge Cir
- 316 Shadow Ridge Cir
- 16 Shadow Mist Dr
- 18 Shadow Mist Dr
- 13 Shadow Mist Dr
- 14 Shadow Mist Dr
- 20 Shadow Mist Dr
- 314 Shadow Ridge Cir
- 325 Shadow Ridge Cir
- 327 Shadow Ridge Cir
- 321 Shadow Ridge Cir
- 323 Shadow Ridge Cir
- 11 Shadow Mist Dr
- 12 Shadow Mist Dr
- 317 Shadow Ridge Cir
- 319 Shadow Ridge Cir
- 401 Shadow Ridge Cir
- 312 Shadow Ridge Cir
Your Personal Tour Guide
Ask me questions while you tour the home.