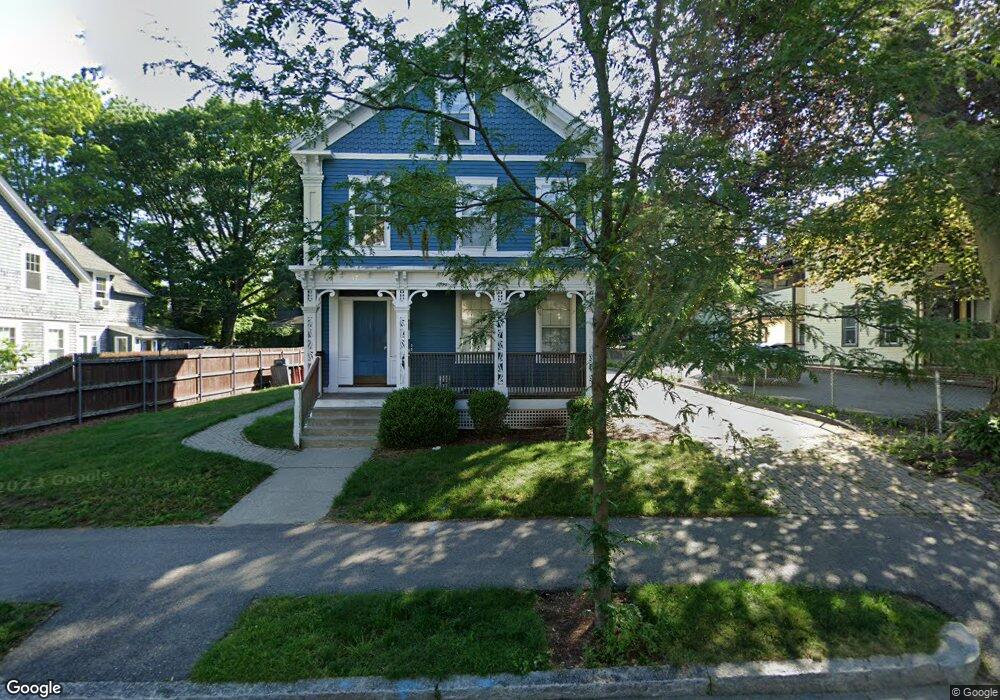
17 Shirley St Worcester, MA 01610
University Park NeighborhoodEstimated Value: $552,000 - $703,000
7
Beds
3
Baths
2,604
Sq Ft
$241/Sq Ft
Est. Value
About This Home
This home is located at 17 Shirley St, Worcester, MA 01610 and is currently estimated at $627,333, approximately $240 per square foot. 17 Shirley St is a home located in Worcester County with nearby schools including Columbus Park Preparatory Academy, Jacob Hiatt Magnet School, and Chandler Magnet.
Ownership History
Date
Name
Owned For
Owner Type
Purchase Details
Closed on
May 21, 2020
Sold by
Barbera Raymond E and Barbera Donovan
Bought by
17 Shirley Llc
Current Estimated Value
Home Financials for this Owner
Home Financials are based on the most recent Mortgage that was taken out on this home.
Original Mortgage
$311,500
Outstanding Balance
$276,032
Interest Rate
3.3%
Mortgage Type
New Conventional
Estimated Equity
$351,301
Purchase Details
Closed on
May 10, 2007
Sold by
Mab Llc
Bought by
Donovan-Barbera Doreen and Barbera Raymond E
Purchase Details
Closed on
Apr 1, 2005
Sold by
Donovan-Barbera Doreen and Barbera Raymond E
Bought by
Mab Llc
Create a Home Valuation Report for This Property
The Home Valuation Report is an in-depth analysis detailing your home's value as well as a comparison with similar homes in the area
Home Values in the Area
Average Home Value in this Area
Purchase History
| Date | Buyer | Sale Price | Title Company |
|---|---|---|---|
| 17 Shirley Llc | -- | None Available | |
| Donovan-Barbera Doreen | -- | -- | |
| Mab Llc | -- | -- |
Source: Public Records
Mortgage History
| Date | Status | Borrower | Loan Amount |
|---|---|---|---|
| Open | 17 Shirley Llc | $311,500 |
Source: Public Records
Tax History Compared to Growth
Tax History
| Year | Tax Paid | Tax Assessment Tax Assessment Total Assessment is a certain percentage of the fair market value that is determined by local assessors to be the total taxable value of land and additions on the property. | Land | Improvement |
|---|---|---|---|---|
| 2025 | $6,037 | $457,700 | $98,100 | $359,600 |
| 2024 | $5,907 | $429,600 | $98,100 | $331,500 |
| 2023 | $5,459 | $380,700 | $85,300 | $295,400 |
| 2022 | $4,890 | $321,500 | $68,300 | $253,200 |
| 2021 | $4,103 | $252,000 | $54,600 | $197,400 |
| 2020 | $3,599 | $211,700 | $54,200 | $157,500 |
| 2019 | $3,688 | $204,900 | $47,400 | $157,500 |
| 2018 | $3,750 | $198,300 | $47,400 | $150,900 |
| 2017 | $3,567 | $185,600 | $47,400 | $138,200 |
| 2016 | $3,409 | $165,400 | $33,700 | $131,700 |
| 2015 | $3,320 | $165,400 | $33,700 | $131,700 |
| 2014 | $3,232 | $165,400 | $33,700 | $131,700 |
Source: Public Records
Map
Nearby Homes
- 19 Shirley St
- 15 Shirley St
- 56 Florence St
- 58 Florence St
- 11 Shirley St
- 73 Downing St Unit 4
- 73 Downing St Unit 3
- 73 Downing St Unit 2
- 73 Downing St Unit 1
- 73 Downing St
- 77 Downing St
- 69 Downing St
- 69 Downing St Unit 1
- 54 Florence St
- 16 Shirley St
- 9 Shirley St
- 60 Florence St
- 81 Downing St
- 14 Shirley St
- 63 Downing St