Estimated Value: $304,000 - $425,000
1
Bed
1
Bath
1,224
Sq Ft
$311/Sq Ft
Est. Value
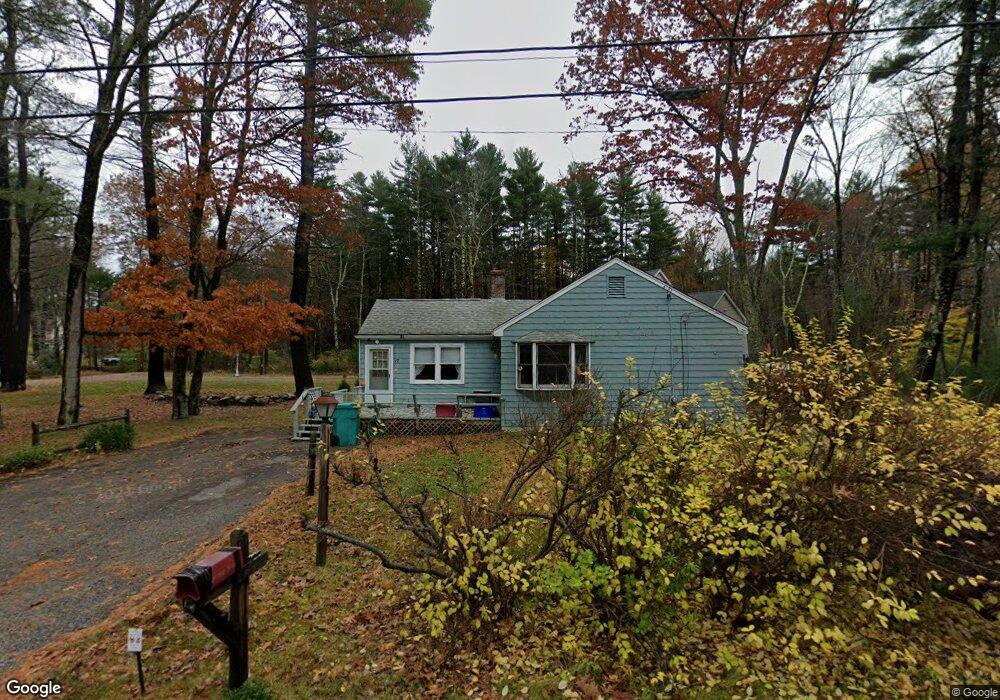
About This Home
This home is located at 17 Shore Dr, Upton, MA 01568 and is currently estimated at $380,113, approximately $310 per square foot. 17 Shore Dr is a home located in Worcester County with nearby schools including Nipmuc Regional High School.
Ownership History
Date
Name
Owned For
Owner Type
Purchase Details
Closed on
Sep 27, 2021
Sold by
Demnic Properties Inc
Bought by
Bartlett Matthew R
Current Estimated Value
Home Financials for this Owner
Home Financials are based on the most recent Mortgage that was taken out on this home.
Original Mortgage
$234,000
Outstanding Balance
$213,386
Interest Rate
2.8%
Mortgage Type
Purchase Money Mortgage
Estimated Equity
$166,727
Purchase Details
Closed on
Jun 25, 2015
Sold by
Porter John F
Bought by
Demnic Properties Inc
Create a Home Valuation Report for This Property
The Home Valuation Report is an in-depth analysis detailing your home's value as well as a comparison with similar homes in the area
Home Values in the Area
Average Home Value in this Area
Purchase History
| Date | Buyer | Sale Price | Title Company |
|---|---|---|---|
| Bartlett Matthew R | $260,000 | None Available | |
| Demnic Properties Inc | $130,000 | -- |
Source: Public Records
Mortgage History
| Date | Status | Borrower | Loan Amount |
|---|---|---|---|
| Open | Bartlett Matthew R | $234,000 |
Source: Public Records
Tax History
| Year | Tax Paid | Tax Assessment Tax Assessment Total Assessment is a certain percentage of the fair market value that is determined by local assessors to be the total taxable value of land and additions on the property. | Land | Improvement |
|---|---|---|---|---|
| 2025 | $4,368 | $332,200 | $201,500 | $130,700 |
| 2024 | $4,415 | $322,700 | $196,000 | $126,700 |
| 2023 | $3,949 | $284,700 | $163,300 | $121,400 |
| 2022 | $4,774 | $284,700 | $163,300 | $121,400 |
| 2021 | $4,394 | $264,700 | $159,500 | $105,200 |
| 2020 | $4,296 | $249,500 | $134,500 | $115,000 |
| 2019 | $4,128 | $238,500 | $117,100 | $121,400 |
| 2018 | $3,699 | $214,700 | $119,200 | $95,500 |
| 2017 | $3,821 | $210,400 | $106,200 | $104,200 |
| 2016 | $3,664 | $197,400 | $93,200 | $104,200 |
| 2015 | $3,287 | $193,900 | $93,200 | $100,700 |
| 2014 | -- | $189,300 | $93,200 | $96,100 |
Source: Public Records
Map
Nearby Homes
- 7 Sawmill Brook Ln
- 6 Sawmill Brook Ln
- 20 Rawson Farm Rd
- 19 Rawson Farm Rd
- 34 Rawson Farm Rd
- 7 Jewell Crossing
- 103 Prairie St
- 185 Prairie St
- 255 Prairie St
- 12 Valerie Run
- 13 Valerie Run
- Lot 24 Monica Way
- Lot 23 Monica Way
- Lot 16 Monica Way
- 3 Moon Hill Rd
- 4 Moon Hill Rd
- 99 W River St
- 19 Monica Way
- 17 Forest Park Dr
- 55 Northbridge Rd
Your Personal Tour Guide
Ask me questions while you tour the home.