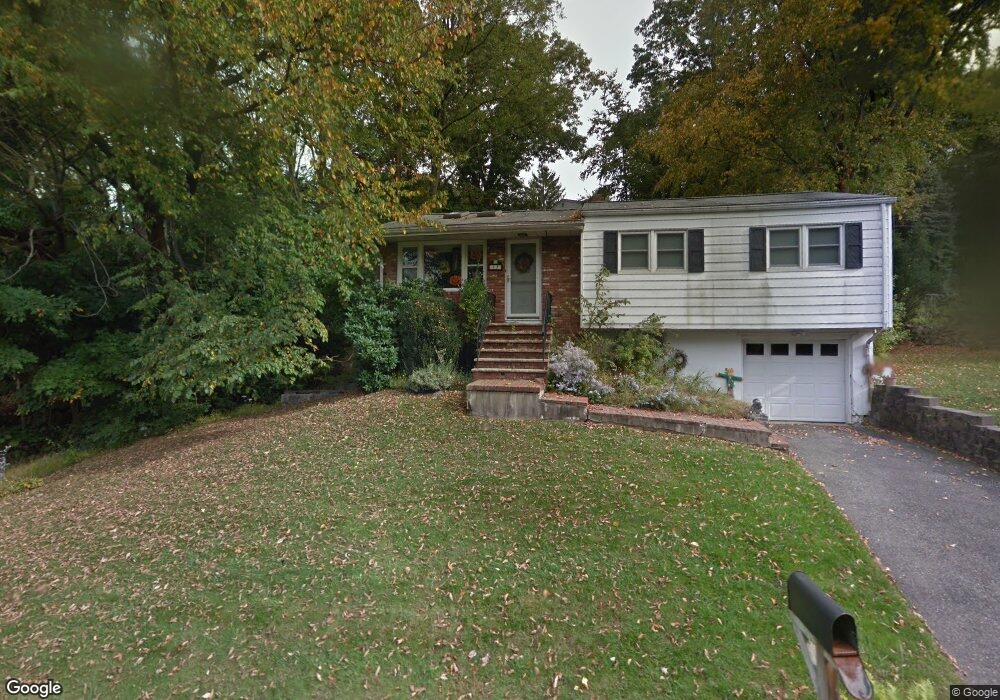
17 Siek Rd Butler, NJ 07405
Estimated Value: $487,000 - $665,000
Studio
--
Bath
1,054
Sq Ft
$521/Sq Ft
Est. Value
About This Home
This home is located at 17 Siek Rd, Butler, NJ 07405 and is currently estimated at $548,986, approximately $520 per square foot. 17 Siek Rd is a home located in Morris County with nearby schools including Aaron Decker School, Richard Butler School, and St Anthony Of Padua.
Ownership History
Date
Name
Owned For
Owner Type
Purchase Details
Closed on
Oct 23, 2000
Sold by
Norvis John W and Norvis Lisa
Bought by
Mcewan James and Mcewan Marguerite
Current Estimated Value
Home Financials for this Owner
Home Financials are based on the most recent Mortgage that was taken out on this home.
Original Mortgage
$140,000
Interest Rate
7.83%
Purchase Details
Closed on
Mar 13, 1997
Sold by
Couch Arthur W and Couch Mary Ann
Bought by
Norvis John W and Norvis Lisa
Create a Home Valuation Report for This Property
The Home Valuation Report is an in-depth analysis detailing your home's value as well as a comparison with similar homes in the area
Home Values in the Area
Average Home Value in this Area
Purchase History
| Date | Buyer | Sale Price | Title Company |
|---|---|---|---|
| Mcewan James | $210,000 | Quest Title Agency Inc | |
| Norvis John W | $165,000 | Colonial Title & Abstract Se |
Source: Public Records
Mortgage History
| Date | Status | Borrower | Loan Amount |
|---|---|---|---|
| Closed | Mcewan James | $140,000 |
Source: Public Records
Tax History
| Year | Tax Paid | Tax Assessment Tax Assessment Total Assessment is a certain percentage of the fair market value that is determined by local assessors to be the total taxable value of land and additions on the property. | Land | Improvement |
|---|---|---|---|---|
| 2025 | $9,611 | $439,200 | $292,000 | $147,200 |
| 2024 | $9,963 | $384,900 | $257,000 | $127,900 |
| 2023 | $9,963 | $375,400 | $252,000 | $123,400 |
| 2022 | $6,571 | $342,300 | $227,000 | $115,300 |
| 2021 | $6,571 | $236,800 | $153,900 | $82,900 |
| 2020 | $8,847 | $236,800 | $153,900 | $82,900 |
| 2019 | $8,653 | $236,800 | $153,900 | $82,900 |
| 2018 | $8,541 | $236,800 | $153,900 | $82,900 |
| 2017 | $8,324 | $236,800 | $153,900 | $82,900 |
| 2016 | $8,108 | $236,800 | $153,900 | $82,900 |
| 2015 | $7,978 | $236,800 | $153,900 | $82,900 |
| 2014 | $7,732 | $236,800 | $153,900 | $82,900 |
Source: Public Records
Map
Nearby Homes
- 7 Alpine Dr
- 18 Stony Hill Ct
- 60 Brown Ave
- 71 Halina Ln
- 86 Kakeout Rd
- 3 Harold Mathews Jr Ct
- 47 Cutlass Rd
- 5 Old Gormley Ln
- 5 Old Gormely Ln
- 20 Center St
- 12 Ledgewood Trail
- 4 Ledgewood Trail
- 2 Cook St
- 86 Reservoir Ave
- 60 Belleview Ave
- 23 Cabot Ln
- 35 Boonton Ave
- 179 Kakeout Rd
- 76 Carey Ave
- 10 Moonshadow Ct
Your Personal Tour Guide
Ask me questions while you tour the home.