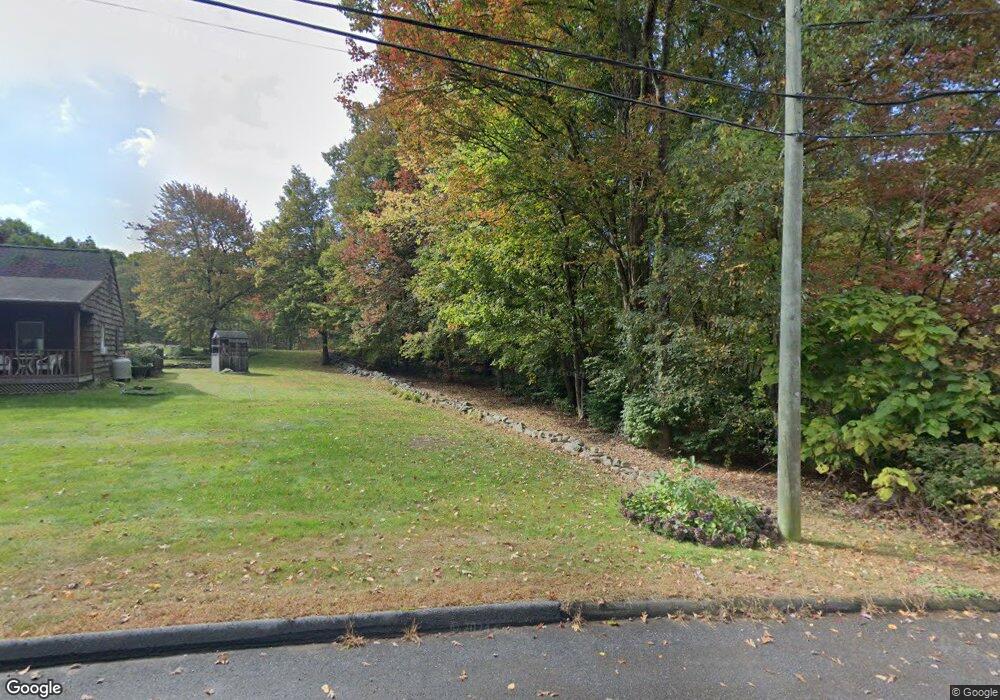
17 Skiperene Ln Burlington, CT 06013
Estimated Value: $665,000 - $786,000
3
Beds
3
Baths
2,839
Sq Ft
$256/Sq Ft
Est. Value
About This Home
This home is located at 17 Skiperene Ln, Burlington, CT 06013 and is currently estimated at $725,724, approximately $255 per square foot. 17 Skiperene Ln is a home located in Hartford County with nearby schools including Lake Garda Elementary School, Har-Bur Middle School, and Lewis S. Mills High School.
Ownership History
Date
Name
Owned For
Owner Type
Purchase Details
Closed on
Nov 30, 2012
Sold by
Nisenson Peter E and Nisenson Megan M
Bought by
Wroblewski Dorota and Wroblewski Marcin
Current Estimated Value
Home Financials for this Owner
Home Financials are based on the most recent Mortgage that was taken out on this home.
Original Mortgage
$315,200
Outstanding Balance
$218,690
Interest Rate
3.4%
Estimated Equity
$507,034
Purchase Details
Closed on
Apr 9, 2007
Sold by
Knapp Barry R
Bought by
Nisenson Peter E and Nisenson Megan M
Purchase Details
Closed on
Feb 26, 2004
Sold by
Pio Christopher
Bought by
Knapp Barry R
Purchase Details
Closed on
Sep 5, 2002
Sold by
Monteleone Luigi and Monteleone Diane M
Bought by
Pio Christopher
Create a Home Valuation Report for This Property
The Home Valuation Report is an in-depth analysis detailing your home's value as well as a comparison with similar homes in the area
Home Values in the Area
Average Home Value in this Area
Purchase History
| Date | Buyer | Sale Price | Title Company |
|---|---|---|---|
| Wroblewski Dorota | $394,000 | -- | |
| Wroblewski Dorota | $394,000 | -- | |
| Nisenson Peter E | $208,000 | -- | |
| Nisenson Peter E | $208,000 | -- | |
| Knapp Barry R | $148,000 | -- | |
| Knapp Barry R | $148,000 | -- | |
| Pio Christopher | $130,000 | -- | |
| Pio Christopher | $130,000 | -- |
Source: Public Records
Mortgage History
| Date | Status | Borrower | Loan Amount |
|---|---|---|---|
| Open | Pio Christopher | $68,700 | |
| Open | Pio Christopher | $315,200 |
Source: Public Records
Tax History Compared to Growth
Tax History
| Year | Tax Paid | Tax Assessment Tax Assessment Total Assessment is a certain percentage of the fair market value that is determined by local assessors to be the total taxable value of land and additions on the property. | Land | Improvement |
|---|---|---|---|---|
| 2025 | $9,491 | $356,790 | $61,880 | $294,910 |
| 2024 | $9,241 | $356,790 | $61,880 | $294,910 |
| 2023 | $8,310 | $258,090 | $68,600 | $189,490 |
| 2022 | $8,440 | $258,090 | $68,600 | $189,490 |
| 2021 | $8,620 | $258,090 | $68,600 | $189,490 |
| 2020 | $8,594 | $258,090 | $68,600 | $189,490 |
| 2019 | $8,517 | $258,090 | $68,600 | $189,490 |
| 2018 | $8,527 | $262,360 | $65,310 | $197,050 |
| 2017 | $8,396 | $262,360 | $65,310 | $197,050 |
| 2016 | $8,291 | $262,360 | $65,310 | $197,050 |
| 2015 | $8,159 | $262,360 | $65,310 | $197,050 |
| 2014 | $7,831 | $262,360 | $65,310 | $197,050 |
Source: Public Records
Map
Nearby Homes