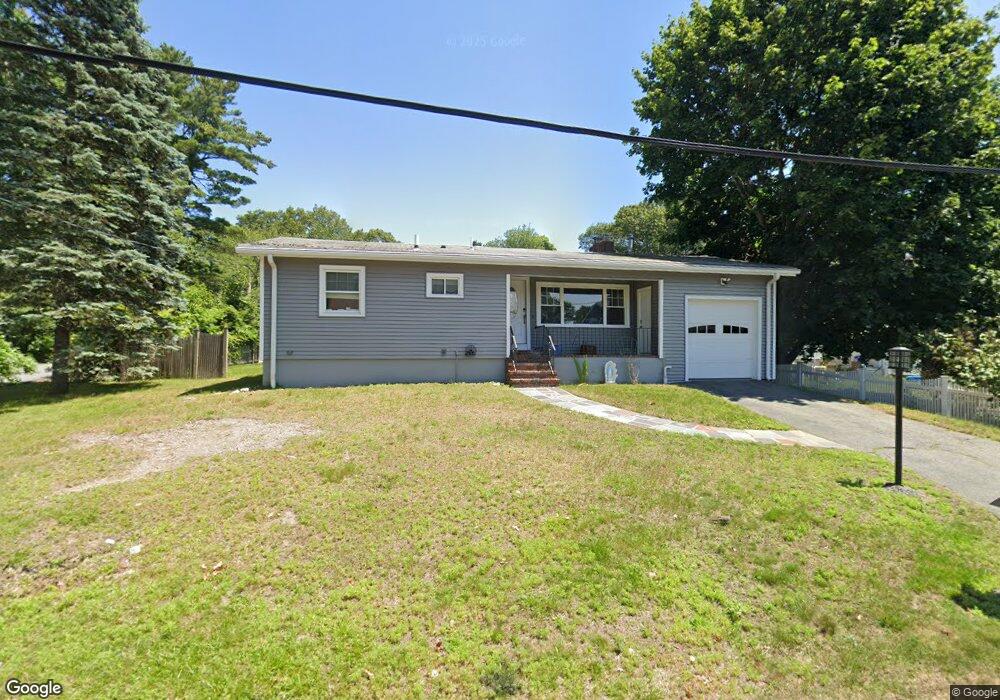
17 Social St Saugus, MA 01906
Lynnhurst NeighborhoodEstimated Value: $582,000 - $810,000
2
Beds
2
Baths
1,607
Sq Ft
$421/Sq Ft
Est. Value
About This Home
This home is located at 17 Social St, Saugus, MA 01906 and is currently estimated at $676,603, approximately $421 per square foot. 17 Social St is a home located in Essex County with nearby schools including Saugus High School and Pioneer Charter School Of Science II.
Ownership History
Date
Name
Owned For
Owner Type
Purchase Details
Closed on
Jul 1, 2021
Sold by
Hughes Richard T
Bought by
Hughes Social T
Current Estimated Value
Purchase Details
Closed on
Aug 22, 1995
Sold by
Ragusa Joseph V
Bought by
Masci Dominic J
Create a Home Valuation Report for This Property
The Home Valuation Report is an in-depth analysis detailing your home's value as well as a comparison with similar homes in the area
Home Values in the Area
Average Home Value in this Area
Purchase History
| Date | Buyer | Sale Price | Title Company |
|---|---|---|---|
| Hughes Social T | -- | None Available | |
| Masci Dominic J | $162,000 | -- |
Source: Public Records
Tax History
| Year | Tax Paid | Tax Assessment Tax Assessment Total Assessment is a certain percentage of the fair market value that is determined by local assessors to be the total taxable value of land and additions on the property. | Land | Improvement |
|---|---|---|---|---|
| 2025 | $5,865 | $549,200 | $308,000 | $241,200 |
| 2024 | $5,614 | $527,100 | $290,400 | $236,700 |
| 2023 | $5,440 | $483,100 | $255,200 | $227,900 |
| 2022 | $5,185 | $431,700 | $234,100 | $197,600 |
| 2021 | $4,621 | $374,500 | $203,300 | $171,200 |
| 2020 | $4,348 | $364,800 | $193,600 | $171,200 |
| 2019 | $4,158 | $341,400 | $176,000 | $165,400 |
| 2018 | $3,826 | $330,400 | $170,700 | $159,700 |
| 2017 | $3,404 | $282,500 | $159,300 | $123,200 |
| 2016 | $3,482 | $285,400 | $159,000 | $126,400 |
| 2015 | $3,267 | $271,800 | $151,400 | $120,400 |
| 2014 | $3,214 | $276,800 | $151,400 | $125,400 |
Source: Public Records
Map
Nearby Homes
Your Personal Tour Guide
Ask me questions while you tour the home.