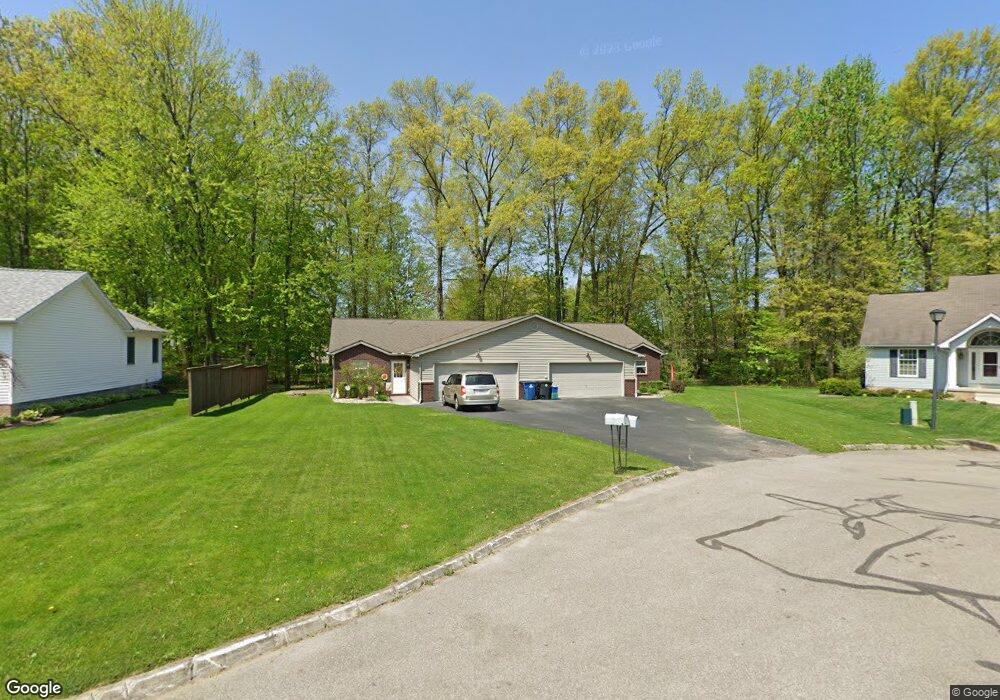
17 Spring Creek Dr Cortland, OH 44410
Estimated Value: $238,000 - $321,186
6
Beds
2
Baths
2,320
Sq Ft
$117/Sq Ft
Est. Value
About This Home
This home is located at 17 Spring Creek Dr, Cortland, OH 44410 and is currently estimated at $272,297, approximately $117 per square foot. 17 Spring Creek Dr is a home located in Trumbull County with nearby schools including Currie Elementary School, Baker Elementary School, and Mathews High School.
Ownership History
Date
Name
Owned For
Owner Type
Purchase Details
Closed on
Jun 20, 2011
Sold by
The Huntington National Bank
Bought by
Vanvalien Michael T and Vanvalien Christine A
Current Estimated Value
Home Financials for this Owner
Home Financials are based on the most recent Mortgage that was taken out on this home.
Original Mortgage
$77,000
Outstanding Balance
$53,082
Interest Rate
4.63%
Mortgage Type
New Conventional
Estimated Equity
$219,215
Purchase Details
Closed on
Feb 25, 2011
Sold by
Hentosh Jerre J and Hentosh Jerre
Bought by
The Huntington National Bank
Purchase Details
Closed on
Jun 1, 2007
Sold by
Tom Gregory Homes Ltd
Bought by
Hentosh Jerry J
Purchase Details
Closed on
May 31, 2007
Sold by
Tom Gregory Homes Ltd
Bought by
Hentosh Jerry J
Purchase Details
Closed on
Apr 11, 1997
Sold by
Tom Gregory Land Company Ltd
Bought by
Allen Michael L and Allen Mary H
Create a Home Valuation Report for This Property
The Home Valuation Report is an in-depth analysis detailing your home's value as well as a comparison with similar homes in the area
Home Values in the Area
Average Home Value in this Area
Purchase History
| Date | Buyer | Sale Price | Title Company |
|---|---|---|---|
| Vanvalien Michael T | $110,000 | Attorney | |
| The Huntington National Bank | $96,000 | Attorney | |
| Hentosh Jerry J | $20,000 | None Available | |
| Hentosh Jerry J | $20,000 | None Available | |
| Allen Michael L | $28,000 | -- |
Source: Public Records
Mortgage History
| Date | Status | Borrower | Loan Amount |
|---|---|---|---|
| Open | Vanvalien Michael T | $77,000 |
Source: Public Records
Tax History Compared to Growth
Tax History
| Year | Tax Paid | Tax Assessment Tax Assessment Total Assessment is a certain percentage of the fair market value that is determined by local assessors to be the total taxable value of land and additions on the property. | Land | Improvement |
|---|---|---|---|---|
| 2024 | $3,852 | $78,190 | $12,880 | $65,310 |
| 2023 | $3,852 | $78,190 | $12,880 | $65,310 |
| 2022 | $3,731 | $59,890 | $11,660 | $48,230 |
| 2021 | $3,740 | $59,890 | $11,660 | $48,230 |
| 2020 | $3,751 | $59,890 | $11,660 | $48,230 |
| 2019 | $3,581 | $54,710 | $11,660 | $43,050 |
| 2018 | $3,555 | $54,710 | $11,660 | $43,050 |
| 2017 | $3,545 | $54,710 | $11,660 | $43,050 |
| 2016 | $3,496 | $52,430 | $12,670 | $39,760 |
| 2015 | $3,472 | $52,430 | $12,670 | $39,760 |
| 2014 | $3,314 | $52,430 | $12,670 | $39,760 |
| 2013 | $3,326 | $52,430 | $12,670 | $39,760 |
Source: Public Records
Map
Nearby Homes
- 19 Spring Creek Dr
- 2 Bayview Cir
- 232 Bayview Dr Unit 232
- VL #8 Maplewood
- VL #7 Maplewood
- 298 Corriedale Dr
- 297 Corriedale Dr
- 266 Corriedale Dr
- 300 Wae Trail
- 314 Deer Creek Trail
- 229 Greenbriar Dr
- 151 Cedar Cir
- 220 Wae Trail
- 2730 Wilson Sharpsville Rd
- 211 Natale Dr
- 278 Rosewae Ave
- 0 Niles Cortland Rd NE Unit 5146227
- 20 Harneds Landing Unit 20
- 3233 Niles Cortland Rd NE
- 167 S Mecca St
- 15 Spring Creek Dr
- 6 Spring Creek Dr
- 8 Spring Creek Dr
- 21 Spring Creek Dr
- 29 Spring Creek Dr
- 18 Spring Creek Dr
- 199 Diamond Way
- 163 Topaz Trail Unit 163
- 161 Topaz Trail
- 16 Eagle Pointe Dr Unit 16
- 15 Eagle Pointe Dr Unit 15
- 11 Spring Creek Dr
- 22 Spring Creek Dr
- 14 Eagle Pointe Dr Unit 14
- 13 Eagle Pointe Dr
- 25 Spring Creek Dr
- 12 Eagle Pointe Dr Unit 12
- 0 Spring Creek Dr
- 197 Diamond Way
- 101 Aspen Place