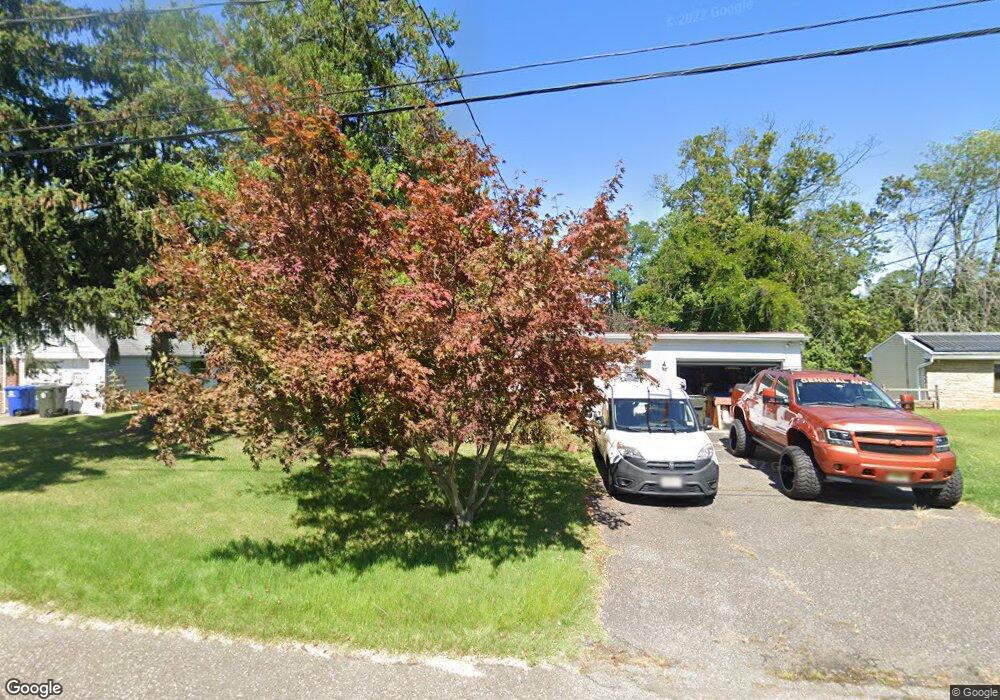
17 Spruce Ave Bordentown, NJ 08505
Estimated Value: $346,427 - $356,000
--
Bed
--
Bath
1,008
Sq Ft
$348/Sq Ft
Est. Value
About This Home
This home is located at 17 Spruce Ave, Bordentown, NJ 08505 and is currently estimated at $350,607, approximately $347 per square foot. 17 Spruce Ave is a home located in Burlington County with nearby schools including Bordentown Reg High School and St Raphael School.
Ownership History
Date
Name
Owned For
Owner Type
Purchase Details
Closed on
Nov 27, 2004
Sold by
Oneill Robert C and Oneill Ruth S
Bought by
Braeckman Daniel and Schmidt Braeckman Julie
Current Estimated Value
Home Financials for this Owner
Home Financials are based on the most recent Mortgage that was taken out on this home.
Original Mortgage
$166,500
Outstanding Balance
$83,106
Interest Rate
5.68%
Mortgage Type
Purchase Money Mortgage
Estimated Equity
$267,501
Purchase Details
Closed on
Aug 31, 1998
Sold by
Nicholas John H and Nicholas Fay L
Bought by
Oneill Ii Robert C and Oneill Ruth S
Create a Home Valuation Report for This Property
The Home Valuation Report is an in-depth analysis detailing your home's value as well as a comparison with similar homes in the area
Home Values in the Area
Average Home Value in this Area
Purchase History
| Date | Buyer | Sale Price | Title Company |
|---|---|---|---|
| Braeckman Daniel | $185,000 | Ctl Title Ins Agency Inc | |
| Oneill Ii Robert C | $122,500 | -- |
Source: Public Records
Mortgage History
| Date | Status | Borrower | Loan Amount |
|---|---|---|---|
| Open | Braeckman Daniel | $166,500 |
Source: Public Records
Tax History Compared to Growth
Tax History
| Year | Tax Paid | Tax Assessment Tax Assessment Total Assessment is a certain percentage of the fair market value that is determined by local assessors to be the total taxable value of land and additions on the property. | Land | Improvement |
|---|---|---|---|---|
| 2025 | $6,341 | $165,000 | $77,000 | $88,000 |
| 2024 | $5,770 | $165,000 | $77,000 | $88,000 |
| 2023 | $5,770 | $165,000 | $77,000 | $88,000 |
| 2022 | $5,762 | $165,000 | $77,000 | $88,000 |
| 2021 | $5,895 | $165,000 | $77,000 | $88,000 |
| 2020 | $5,917 | $165,000 | $77,000 | $88,000 |
| 2019 | $5,780 | $165,000 | $77,000 | $88,000 |
| 2018 | $5,693 | $165,000 | $77,000 | $88,000 |
| 2017 | $5,589 | $165,000 | $77,000 | $88,000 |
| 2016 | $5,462 | $165,000 | $77,000 | $88,000 |
| 2015 | $5,287 | $165,000 | $77,000 | $88,000 |
| 2014 | $5,044 | $165,000 | $77,000 | $88,000 |
Source: Public Records
Map
Nearby Homes