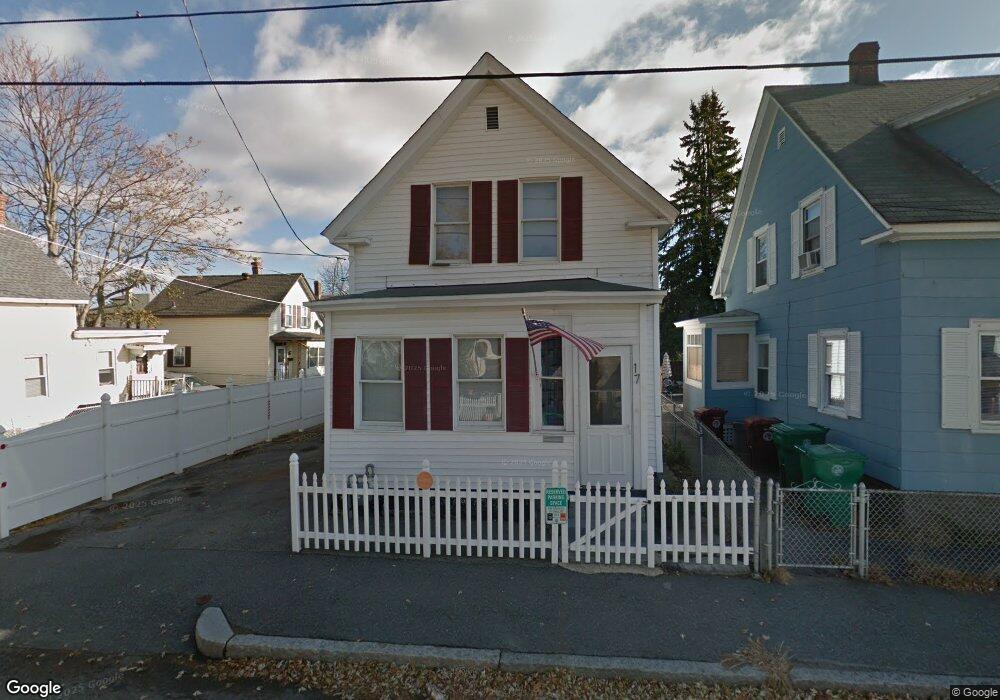
17 Stanley St Lowell, MA 01850
Centralville NeighborhoodEstimated Value: $382,000 - $431,000
3
Beds
1
Bath
1,321
Sq Ft
$307/Sq Ft
Est. Value
About This Home
This home is located at 17 Stanley St, Lowell, MA 01850 and is currently estimated at $405,899, approximately $307 per square foot. 17 Stanley St is a home located in Middlesex County with nearby schools including Greenhalge Elementary School, S. Christa McAuliffe Elementary School, and Moody Elementary School.
Ownership History
Date
Name
Owned For
Owner Type
Purchase Details
Closed on
Jul 16, 2008
Sold by
Molinari John
Bought by
Miller Anthony Alan
Current Estimated Value
Purchase Details
Closed on
Apr 9, 2008
Sold by
Baystate Prop Re Llc
Bought by
Molinari John
Purchase Details
Closed on
Apr 7, 2008
Sold by
Accredited Hm Lenders
Bought by
Baystate Prop Re Llc
Purchase Details
Closed on
Oct 19, 2006
Sold by
Kuria Joseph and Mers
Bought by
Accredited Home Lender
Purchase Details
Closed on
Dec 14, 2005
Sold by
Oeung Samoeun
Bought by
Kuria Joseph
Purchase Details
Closed on
May 27, 2003
Sold by
Wilson Helen V and Wilson Helen
Bought by
Oeung Samoeun
Purchase Details
Closed on
Aug 18, 1997
Sold by
Hagopian Steven C
Bought by
Wilson Helen and Wilson Lorena A
Purchase Details
Closed on
Apr 22, 1996
Sold by
Callahan James T
Bought by
Hagopian Steven C
Create a Home Valuation Report for This Property
The Home Valuation Report is an in-depth analysis detailing your home's value as well as a comparison with similar homes in the area
Home Values in the Area
Average Home Value in this Area
Purchase History
| Date | Buyer | Sale Price | Title Company |
|---|---|---|---|
| Miller Anthony Alan | $168,000 | -- | |
| Miller Anthony Alan | $168,000 | -- | |
| Molinari John | $85,000 | -- | |
| Molinari John | $85,000 | -- | |
| Baystate Prop Re Llc | $27,300 | -- | |
| Baystate Prop Re Llc | $27,300 | -- | |
| Accredited Home Lender | $220,000 | -- | |
| Accredited Home Lender | $220,000 | -- | |
| Kuria Joseph | $260,000 | -- | |
| Kuria Joseph | $260,000 | -- | |
| Oeung Samoeun | $149,000 | -- | |
| Oeung Samoeun | $149,000 | -- | |
| Wilson Helen | $62,900 | -- | |
| Wilson Helen V | $62,900 | -- | |
| Hagopian Steven C | $29,500 | -- | |
| Hagopian Steven C | $29,500 | -- |
Source: Public Records
Mortgage History
| Date | Status | Borrower | Loan Amount |
|---|---|---|---|
| Open | Hagopian Steven C | $166,497 | |
| Closed | Hagopian Steven C | $167,885 |
Source: Public Records
Tax History
| Year | Tax Paid | Tax Assessment Tax Assessment Total Assessment is a certain percentage of the fair market value that is determined by local assessors to be the total taxable value of land and additions on the property. | Land | Improvement |
|---|---|---|---|---|
| 2025 | $4,033 | $351,300 | $98,100 | $253,200 |
| 2024 | $3,870 | $324,900 | $86,300 | $238,600 |
| 2023 | $3,659 | $294,600 | $75,000 | $219,600 |
| 2022 | $3,292 | $259,400 | $63,900 | $195,500 |
| 2021 | $3,076 | $228,500 | $55,600 | $172,900 |
| 2020 | $3,058 | $228,900 | $64,600 | $164,300 |
| 2019 | $2,753 | $196,100 | $57,000 | $139,100 |
| 2018 | $2,692 | $187,100 | $54,300 | $132,800 |
| 2017 | $2,615 | $175,300 | $49,300 | $126,000 |
| 2016 | $2,335 | $154,000 | $40,100 | $113,900 |
| 2015 | $2,226 | $143,800 | $38,400 | $105,400 |
| 2013 | $2,101 | $140,000 | $46,900 | $93,100 |
Source: Public Records
Map
Nearby Homes
- 45 W 4th St
- 99 W 6th St
- 174 River Rd
- 130 John St Unit G45
- 130 John St Unit 350
- 130 John St Unit G01
- 130 John St Unit 242
- 130 John St Unit 250
- 27 Bunker Hill Ave
- 27-29 Fifth St
- 25 Read St
- 52 Lawrence Dr Unit 206
- 94 1st St Unit 10
- 10 Kearney Square Unit 407
- 105 3rd St
- 9 Central St Unit 601
- 9 Central St Unit 602
- 106 Methuen St Unit B
- 23-33 Middle St Unit 6
- 23-33 Middle St Unit 21
Your Personal Tour Guide
Ask me questions while you tour the home.