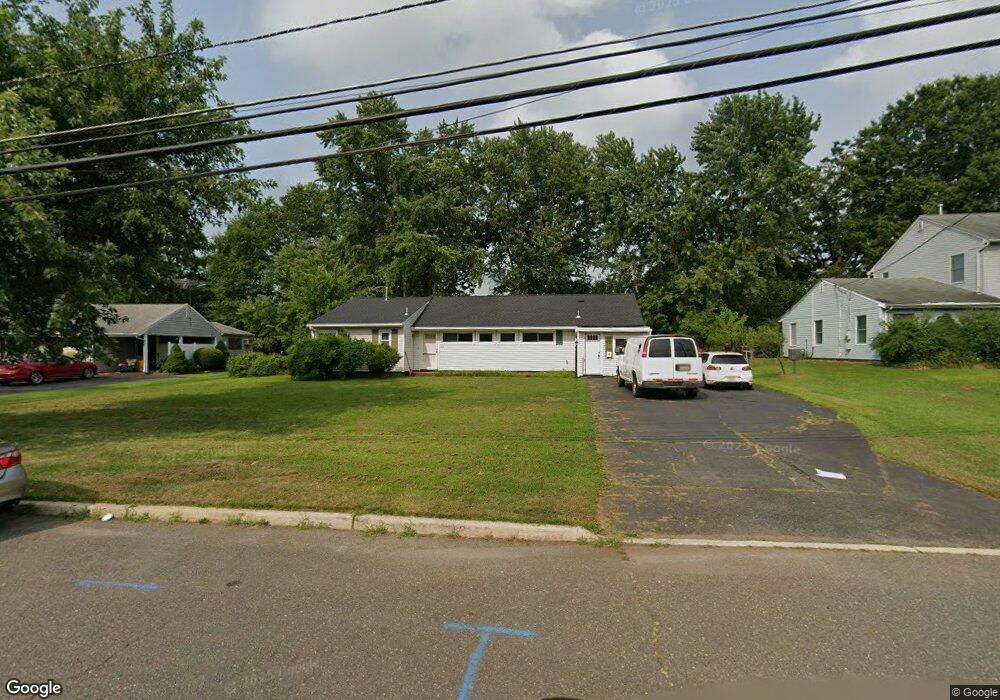
17 Stanworth Rd Kendall Park, NJ 08824
Estimated Value: $522,000 - $552,000
--
Bed
--
Bath
1,597
Sq Ft
$339/Sq Ft
Est. Value
About This Home
This home is located at 17 Stanworth Rd, Kendall Park, NJ 08824 and is currently estimated at $541,174, approximately $338 per square foot. 17 Stanworth Rd is a home located in Middlesex County with nearby schools including Cambridge Elementary School, Crossroads South Middle School, and South Brunswick High School.
Ownership History
Date
Name
Owned For
Owner Type
Purchase Details
Closed on
Aug 27, 2007
Sold by
Farris Edmund and Farris Marie
Bought by
Siddiqi Fawad and Adhami Abir
Current Estimated Value
Home Financials for this Owner
Home Financials are based on the most recent Mortgage that was taken out on this home.
Original Mortgage
$269,600
Interest Rate
6.51%
Mortgage Type
Purchase Money Mortgage
Create a Home Valuation Report for This Property
The Home Valuation Report is an in-depth analysis detailing your home's value as well as a comparison with similar homes in the area
Home Values in the Area
Average Home Value in this Area
Purchase History
| Date | Buyer | Sale Price | Title Company |
|---|---|---|---|
| Siddiqi Fawad | $337,000 | Stewart Title Guaranty Co |
Source: Public Records
Mortgage History
| Date | Status | Borrower | Loan Amount |
|---|---|---|---|
| Previous Owner | Siddiqi Fawad | $269,600 |
Source: Public Records
Tax History Compared to Growth
Tax History
| Year | Tax Paid | Tax Assessment Tax Assessment Total Assessment is a certain percentage of the fair market value that is determined by local assessors to be the total taxable value of land and additions on the property. | Land | Improvement |
|---|---|---|---|---|
| 2025 | $8,131 | $149,300 | $75,400 | $73,900 |
| 2024 | $7,718 | $149,300 | $75,400 | $73,900 |
| 2023 | $7,718 | $147,000 | $75,400 | $71,600 |
| 2022 | $7,491 | $147,000 | $75,400 | $71,600 |
| 2021 | $5,762 | $147,000 | $75,400 | $71,600 |
| 2020 | $7,532 | $147,000 | $75,400 | $71,600 |
| 2019 | $7,598 | $147,000 | $75,400 | $71,600 |
| 2018 | $7,350 | $147,000 | $75,400 | $71,600 |
| 2017 | $7,338 | $147,000 | $75,400 | $71,600 |
| 2016 | $7,260 | $147,000 | $75,400 | $71,600 |
| 2015 | $7,040 | $147,000 | $75,400 | $71,600 |
| 2014 | $6,927 | $147,000 | $75,400 | $71,600 |
Source: Public Records
Map
Nearby Homes