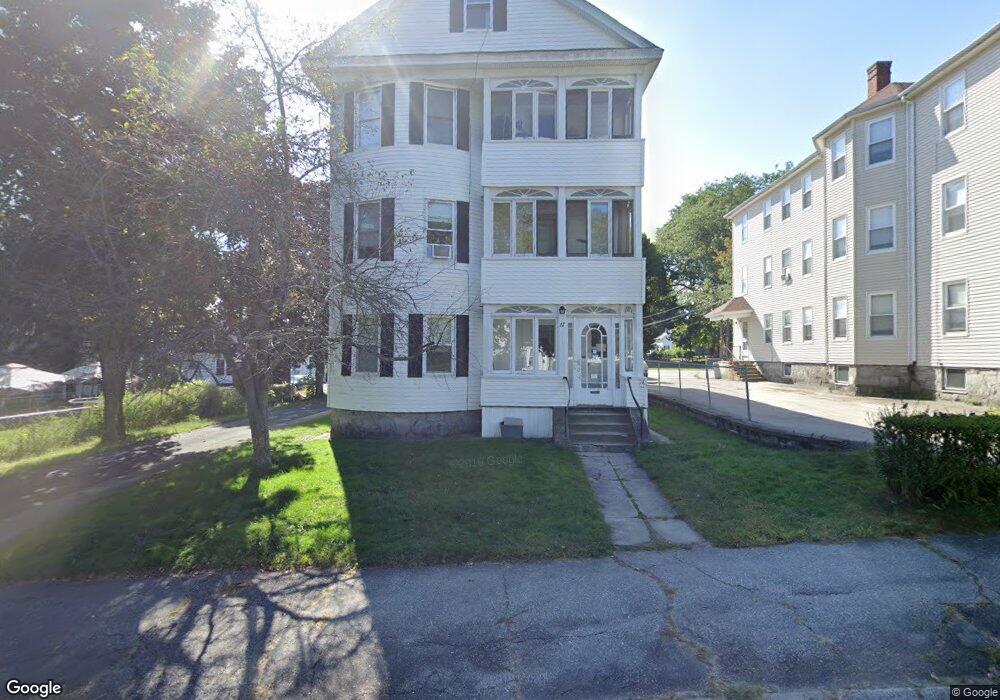
17 Stebbins St Worcester, MA 01607
North Quinsigamond Village NeighborhoodEstimated Value: $507,043 - $783,000
3
Beds
1
Bath
1,000
Sq Ft
$637/Sq Ft
Est. Value
About This Home
This home is located at 17 Stebbins St, Worcester, MA 01607 and is currently estimated at $637,261, approximately $637 per square foot. 17 Stebbins St is a home located in Worcester County with nearby schools including Quinsigamond School, Jacob Hiatt Magnet School, and Chandler Magnet.
Ownership History
Date
Name
Owned For
Owner Type
Purchase Details
Closed on
Dec 11, 2013
Sold by
Penny Richard H and Penny Anthony E
Bought by
Penny Richard H
Current Estimated Value
Purchase Details
Closed on
Jul 15, 2010
Sold by
Penny Richard H and Penny Anthony E
Bought by
Penny Richard H and Penny Anthony E
Purchase Details
Closed on
May 22, 2008
Sold by
Penny Richard H
Bought by
Penny Anthony E and Penny Richard H
Purchase Details
Closed on
Jul 9, 1993
Sold by
Rudman Richard A and Rudman Carol
Bought by
Penny Richard H
Home Financials for this Owner
Home Financials are based on the most recent Mortgage that was taken out on this home.
Original Mortgage
$110,700
Interest Rate
7.43%
Mortgage Type
Purchase Money Mortgage
Create a Home Valuation Report for This Property
The Home Valuation Report is an in-depth analysis detailing your home's value as well as a comparison with similar homes in the area
Home Values in the Area
Average Home Value in this Area
Purchase History
| Date | Buyer | Sale Price | Title Company |
|---|---|---|---|
| Penny Richard H | -- | -- | |
| Penny Richard H | -- | -- | |
| Penny Anthony E | -- | -- | |
| Penny Richard H | $123,000 | -- |
Source: Public Records
Mortgage History
| Date | Status | Borrower | Loan Amount |
|---|---|---|---|
| Previous Owner | Penny Richard H | $192,000 | |
| Previous Owner | Penny Richard H | $160,800 | |
| Previous Owner | Penny Richard H | $110,700 |
Source: Public Records
Tax History
| Year | Tax Paid | Tax Assessment Tax Assessment Total Assessment is a certain percentage of the fair market value that is determined by local assessors to be the total taxable value of land and additions on the property. | Land | Improvement |
|---|---|---|---|---|
| 2025 | $8,671 | $657,400 | $118,800 | $538,600 |
| 2024 | $8,051 | $585,500 | $118,800 | $466,700 |
| 2023 | $7,701 | $537,000 | $103,200 | $433,800 |
| 2022 | $6,717 | $441,600 | $82,600 | $359,000 |
| 2021 | $5,980 | $367,300 | $66,100 | $301,200 |
| 2020 | $5,581 | $328,300 | $66,100 | $262,200 |
| 2019 | $4,860 | $270,000 | $59,500 | $210,500 |
| 2018 | $4,788 | $253,200 | $59,500 | $193,700 |
| 2017 | $4,532 | $235,800 | $59,500 | $176,300 |
| 2016 | $4,291 | $208,200 | $43,800 | $164,400 |
| 2015 | $4,179 | $208,200 | $43,800 | $164,400 |
| 2014 | $4,068 | $208,200 | $43,800 | $164,400 |
Source: Public Records
Map
Nearby Homes
- 17 Stebbins St Unit 3
- 15 Stebbins St
- 19 Stebbins St
- 23 Stebbins St
- 25 Stebbins St
- 18 Falmouth St
- 18 Stebbins St
- 27 Stebbins St
- 20 Stebbins St
- 4 Stebbins St
- 24 Stebbins St
- 29 Stebbins St
- 20 Falmouth St
- 26 Stebbins St
- 26 Stebbins St Unit 2
- 26 Stebbins St Unit 3
- 22 Falmouth St
- 24 Falmouth St
- 28 Stebbins St
- 31 Stebbins St
Your Personal Tour Guide
Ask me questions while you tour the home.