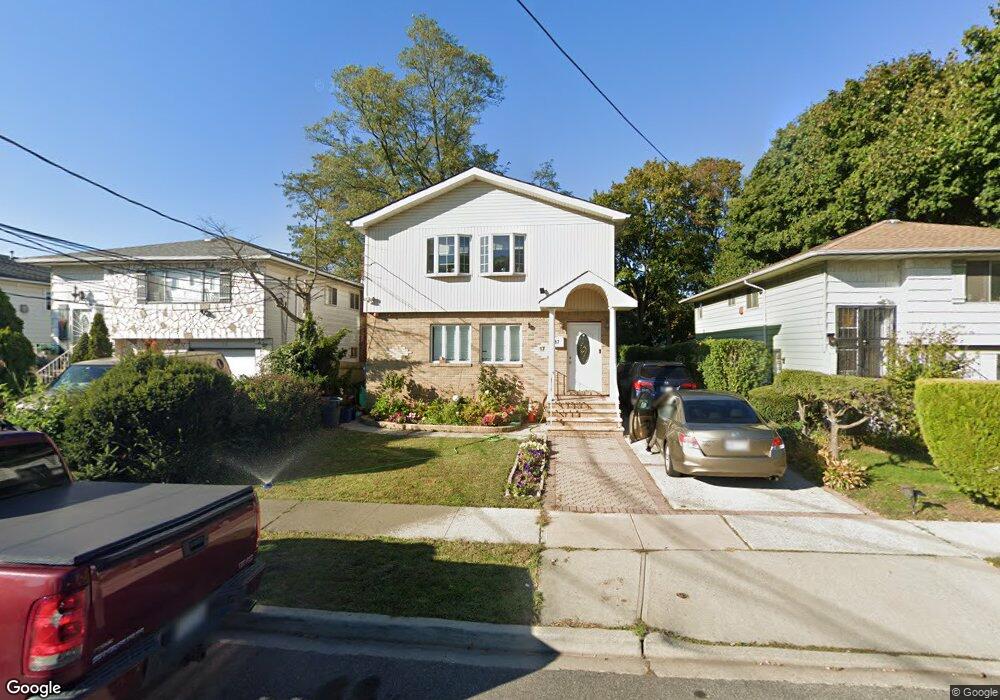
17 Sterling Place Hempstead, NY 11550
Estimated Value: $568,000 - $702,547
Studio
3
Baths
2,225
Sq Ft
$286/Sq Ft
Est. Value
About This Home
This home is located at 17 Sterling Place, Hempstead, NY 11550 and is currently estimated at $635,274, approximately $285 per square foot. 17 Sterling Place is a home located in Nassau County with nearby schools including Evergreen Charter School and Crescent School.
Ownership History
Date
Name
Owned For
Owner Type
Purchase Details
Closed on
Sep 26, 2022
Sold by
Alvarez Steven and Alvarez Salvador Santos
Bought by
Alvarez Jose Leonel
Current Estimated Value
Home Financials for this Owner
Home Financials are based on the most recent Mortgage that was taken out on this home.
Original Mortgage
$350,000
Outstanding Balance
$335,618
Interest Rate
5.55%
Mortgage Type
New Conventional
Estimated Equity
$299,656
Purchase Details
Closed on
Jun 18, 2019
Sold by
Alvarez Jose L and Alvarez Jose C
Bought by
Alvarez Steven and Alvarez Salvador Santos
Home Financials for this Owner
Home Financials are based on the most recent Mortgage that was taken out on this home.
Original Mortgage
$336,000
Interest Rate
4%
Mortgage Type
New Conventional
Purchase Details
Closed on
Feb 17, 1998
Sold by
Rose Alvin J and Rose Pamela V
Bought by
Alvarez Jose L and Alvarez Jose C
Create a Home Valuation Report for This Property
The Home Valuation Report is an in-depth analysis detailing your home's value as well as a comparison with similar homes in the area
Home Values in the Area
Average Home Value in this Area
Purchase History
| Date | Buyer | Sale Price | Title Company |
|---|---|---|---|
| Alvarez Jose Leonel | -- | Security Ttl Guarantee Corp | |
| Alvarez Steven | $420,000 | First American Title | |
| Alvarez Jose L | $155,000 | -- |
Source: Public Records
Mortgage History
| Date | Status | Borrower | Loan Amount |
|---|---|---|---|
| Open | Alvarez Jose Leonel | $350,000 | |
| Closed | Alvarez Steven | $336,000 |
Source: Public Records
Tax History
| Year | Tax Paid | Tax Assessment Tax Assessment Total Assessment is a certain percentage of the fair market value that is determined by local assessors to be the total taxable value of land and additions on the property. | Land | Improvement |
|---|---|---|---|---|
| 2025 | $10,228 | $403 | $120 | $283 |
| 2024 | $1,100 | $403 | $120 | $283 |
Source: Public Records
Map
Nearby Homes
- 29 Sterling Place
- 23 Peters Ave
- 44 Nassau Pkwy
- 7 Bernhard St
- 36 Monroe Place
- 182 Long Beach Rd
- 16 Garfield Place
- 28 Elizabeth Ave
- 34 Frazier St
- 33 Linden Ave
- 138 Windsor Pkwy
- 141 Booth St
- 30 Pierson Ave
- 75 Elizabeth Ave
- 50 Marvin Ave
- 19 Hamilton Place
- 12 Taylor Place
- 69 Glenmore Ave
- 3840 Linden Place
- 101 Baldwin Rd
- 21 Sterling Place
- 13 Sterling Place
- 7 Sterling Place
- 352 S Franklin St
- 346 S Franklin St
- 358 S Franklin St
- 18 Peters Ave
- 22 Peters Ave
- 26 Peters Ave
- 31 Sterling Place
- 14 Peters Ave
- 10 Peters Ave
- 32 Peters Ave
- 20 Sterling Place
- 35 Sterling Place
- 6 Peters Ave
- 26 Sterling Place
- 370 S Franklin St
- 34 Peters Ave
- 38 Peters Ave
Your Personal Tour Guide
Ask me questions while you tour the home.