Estimated Value: $291,000 - $343,000
3
Beds
2
Baths
1,967
Sq Ft
$157/Sq Ft
Est. Value
About This Home
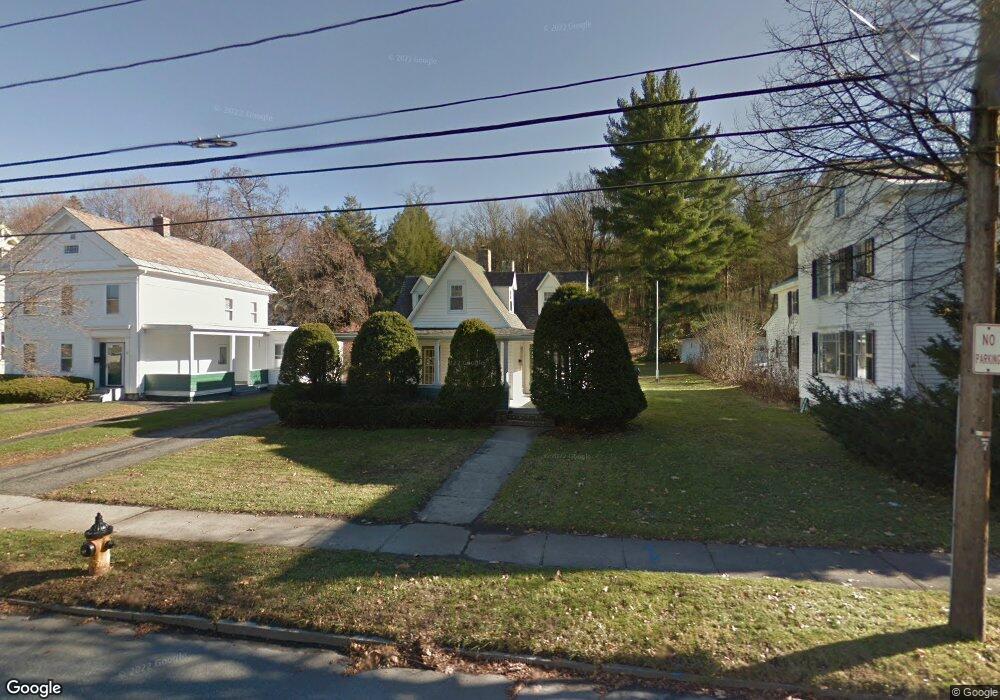
This home is located at 17 Summer St, Adams, MA 01220 and is currently estimated at $308,464, approximately $156 per square foot. 17 Summer St is a home located in Berkshire County with nearby schools including Hoosac Valley Middle & High School, Berkshire Arts & Technology Charter Public School, and St. Stanislaus Kostka School.
Ownership History
Date
Name
Owned For
Owner Type
Purchase Details
Closed on
Jan 31, 2013
Sold by
Buckley Robert F
Bought by
Buckley Robert F
Current Estimated Value
Purchase Details
Closed on
May 15, 1990
Sold by
Gravel Charles L
Bought by
Buckley Robert F
Home Financials for this Owner
Home Financials are based on the most recent Mortgage that was taken out on this home.
Original Mortgage
$85,600
Interest Rate
10.15%
Mortgage Type
Purchase Money Mortgage
Create a Home Valuation Report for This Property
The Home Valuation Report is an in-depth analysis detailing your home's value as well as a comparison with similar homes in the area
Home Values in the Area
Average Home Value in this Area
Purchase History
| Date | Buyer | Sale Price | Title Company |
|---|---|---|---|
| Buckley Robert F | -- | -- | |
| Buckley Robert F | $107,000 | -- |
Source: Public Records
Mortgage History
| Date | Status | Borrower | Loan Amount |
|---|---|---|---|
| Previous Owner | Buckley Robert F | $20,000 | |
| Previous Owner | Buckley Robert F | $84,500 | |
| Previous Owner | Buckley Robert F | $85,600 |
Source: Public Records
Tax History Compared to Growth
Tax History
| Year | Tax Paid | Tax Assessment Tax Assessment Total Assessment is a certain percentage of the fair market value that is determined by local assessors to be the total taxable value of land and additions on the property. | Land | Improvement |
|---|---|---|---|---|
| 2025 | $4,452 | $261,700 | $56,700 | $205,000 |
| 2024 | $4,199 | $239,400 | $53,400 | $186,000 |
| 2023 | $3,920 | $211,300 | $48,500 | $162,800 |
| 2022 | $3,829 | $183,300 | $42,200 | $141,100 |
| 2021 | $3,741 | $165,400 | $42,200 | $123,200 |
| 2020 | $3,566 | $163,000 | $42,500 | $120,500 |
| 2019 | $3,487 | $163,000 | $42,500 | $120,500 |
| 2018 | $3,571 | $160,800 | $42,500 | $118,300 |
| 2017 | $3,953 | $185,000 | $42,500 | $142,500 |
| 2016 | $3,476 | $162,500 | $42,500 | $120,000 |
| 2015 | $3,385 | $158,400 | $44,400 | $114,000 |
| 2014 | $3,160 | $158,400 | $44,400 | $114,000 |
Source: Public Records
Map
Nearby Homes